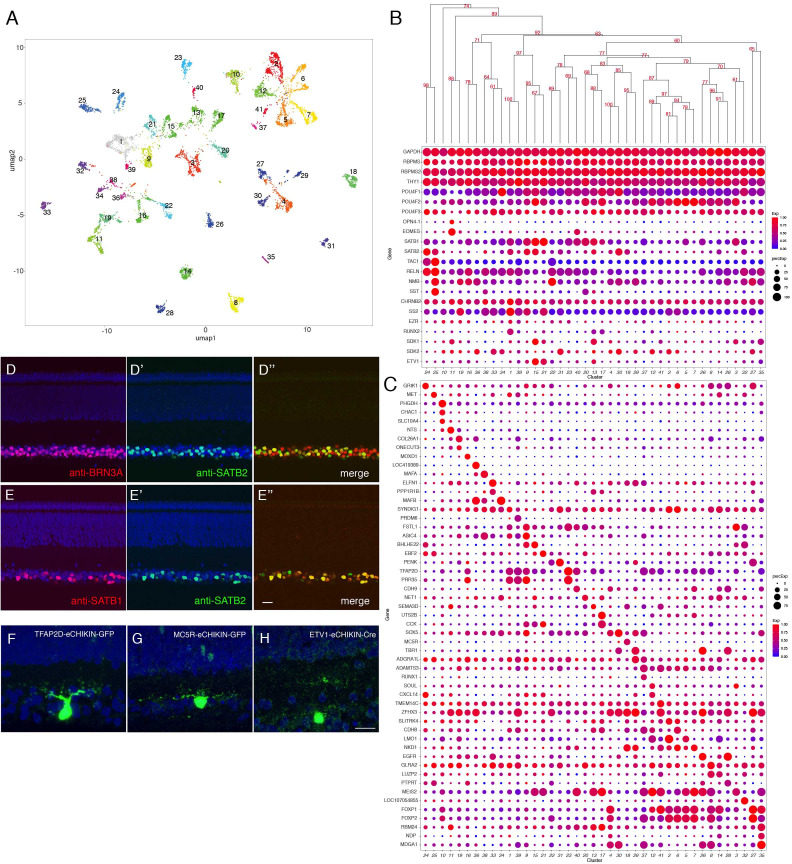
Figure 7. Classification and characterization of RGCs.
(A) Clustering of E16 RGCs using UMAP. (B) Dot plots showing expression of selected genes expressed in all or subsets of RGCs. Numbers correspond to clusters in A. Dendrogram above dots shows transcriptional relationships of clusters. (C) Dot plots showing expression of genes selectively expressed in RGC clusters. (D, E) Immunostaining of E16 retina for SATB2 and BRN3A/POU4F1 (D) and for SATB1 and SATB2 (E). (F–H) RGCs labeled by eCHIKIN-mediated GFP insertion in TFAP2D (GC23; F), MC5R (GC18; G), and ETV1 (GC15; H). Bars in E and H, 10 µm.
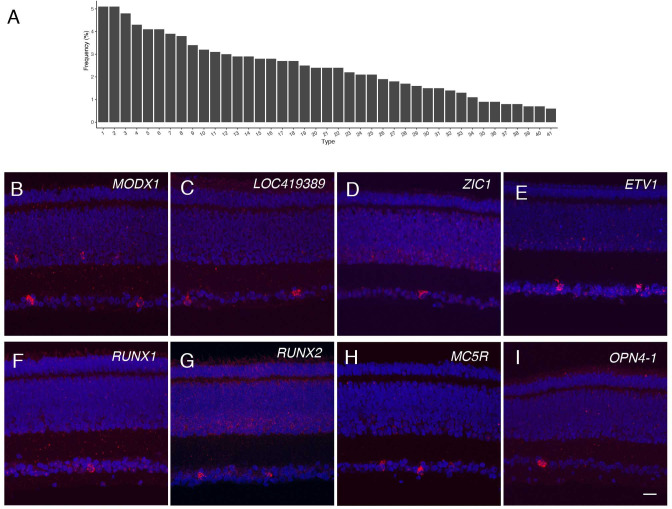
Figure 7—figure supplement 1. Frequency distribution and morphological analysis of retinal ganglion cell types.
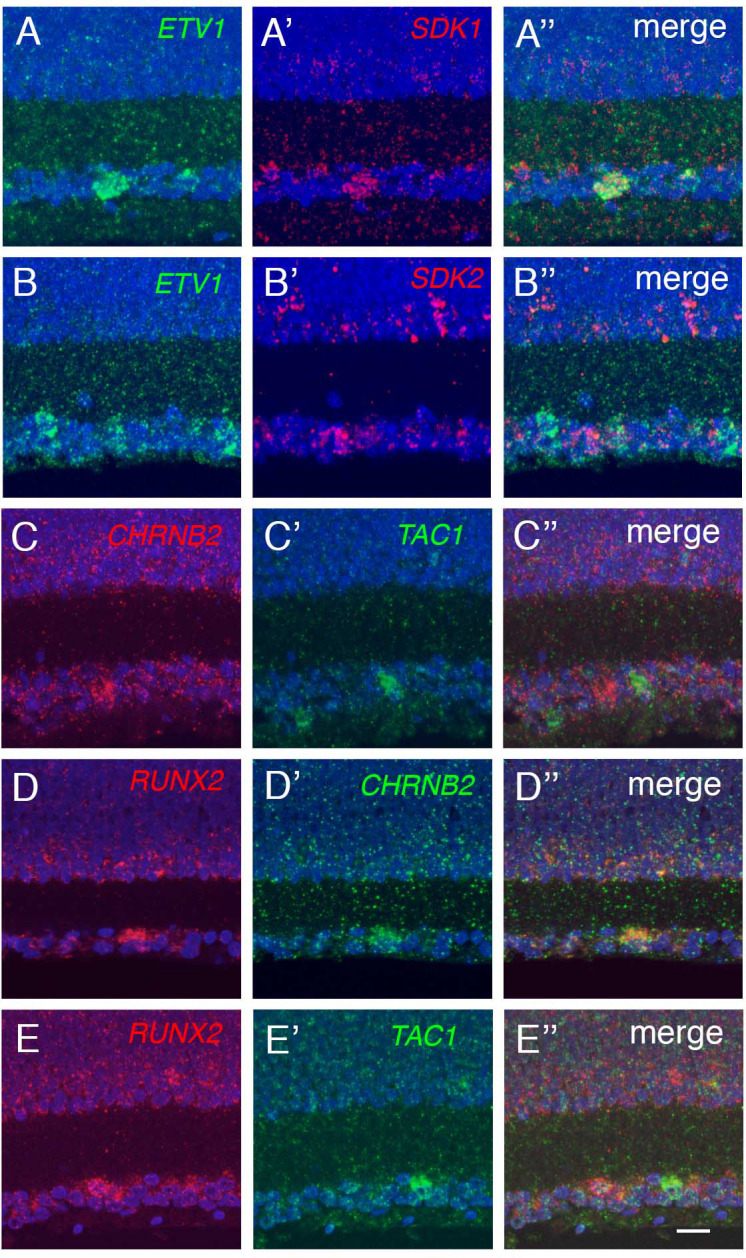
Figure 7—figure supplement 2. Markers expressed and co-expressed by key retinal ganglion cell types.


