. 2021 Jan 4;10:e63907. doi: 10.7554/eLife.63907

Figure 8. Transcriptomic map of topographic position in Müller glia.

(A) Clustering of E18 MGs using UMAP. Inset shows relationship between clusters and retinal position. (B,C) Violin (B) and feature (C) plots of genes differentially expressed among MG clusters. B also shows that pan-MG genes SLC1A3 and RLBP1 are expressed at similar levels among clusters. (D, E) In situ hybridization for WIF1 (D) and CHRDL1(E) on whole mounts at E13 photographed from the posterior (top panels) or anterior (bottom panels). The black structure at the ventral edge in the bottom panels is the intrinsically pigmented pecten oculi. Bar, 1 mm. (F–Q) In situ hybridization on sections from indicated retinal regions to show position-selective of genes from C in Müller glia. F-I WIF1 and CHRDL1 on E16 dorsal and ventral sections. CHRDL1 is also in a subset of amacrine cells throughout the retina. (J–M) FOXG1 and FOXI2 on E14 nasal and temporal sections. (N–Q) PSCA and TMEM123 on E16 central and peripheral sections. Bar, 10 µm. (R) Summary of position-dependent expression of genes in Müller glia at E16, based on images such as those in D-Q.

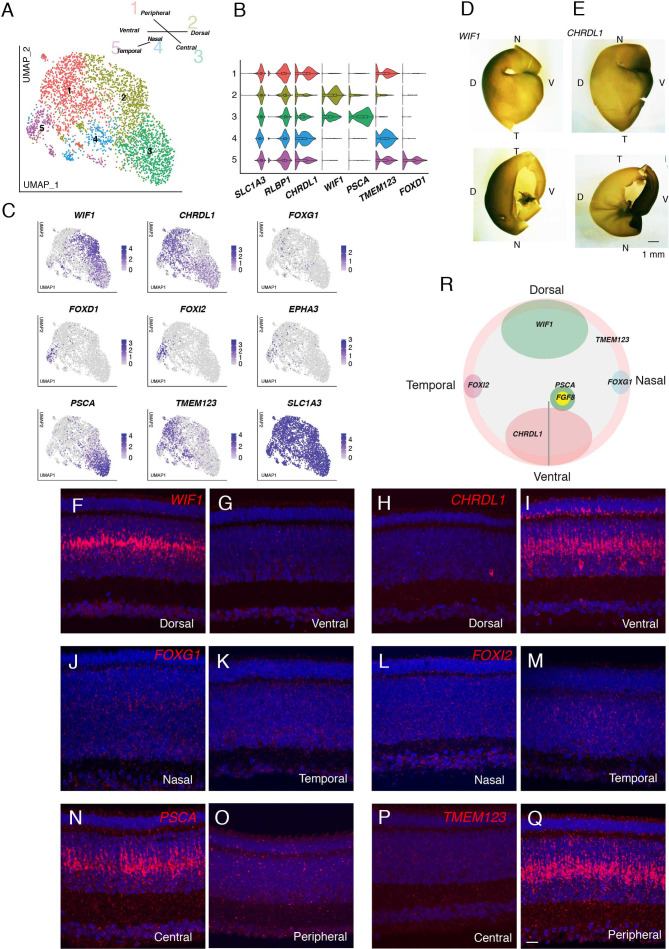
Figure 8.

Figure 8—figure supplement 1. Regional distributions of Müller glial cell positional variants.

Figure 8—figure supplement 1.

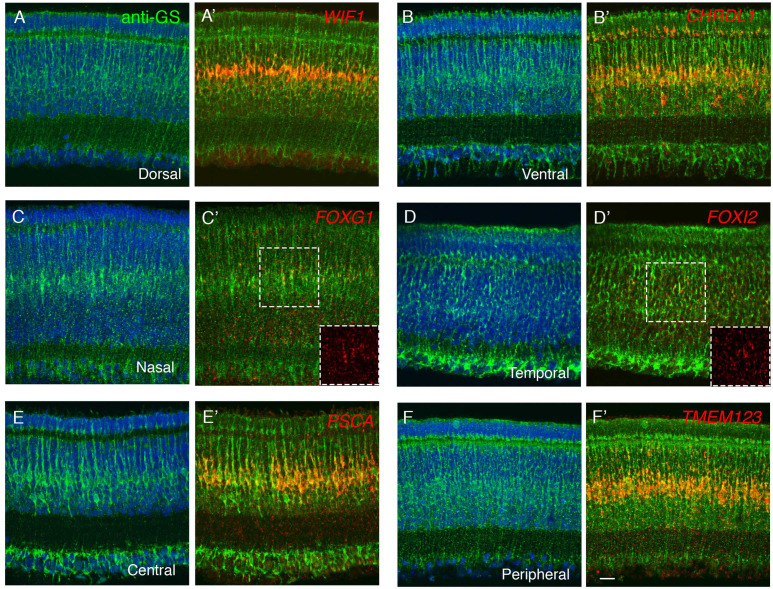
(A–F) In situ hybridization for WIF1 (A), CHRDL1(B) at E16, FOXG1 (C), FOXI2 (D) at E14, PSCA (E), TMEM123 (F) at E16. Sections were co-stained with anti-glutamate synthetase (anti-GS), showing that these genes are selectively expressed in Muller glia. Bar, 10 µm.
Figure 8—figure supplement 2. Co-expression of positional markers in Müller glia.

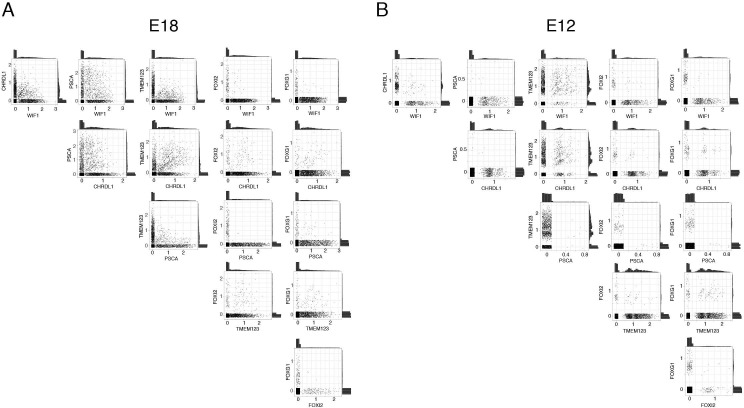
Figure 8—figure supplement 2.

Co-expression in E18 (A) and E12 (B) retina. The x-axis and y-axis are the expression level of the marker genes, and each dot represents one Müller glial cell. Histogram plots on the top and right of each panel show the overall expression level of the two genes.
Figure 8—figure supplement 3. Developmental trajectories of Müller glial cell variants.

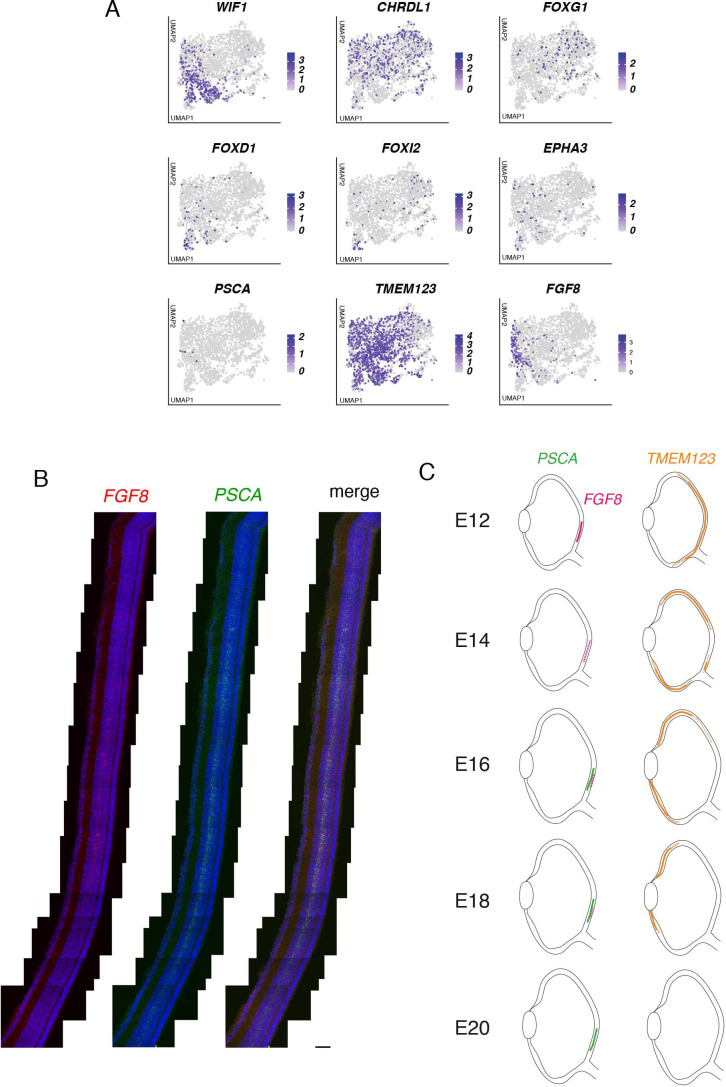
Figure 8—figure supplement 3.

(A) Feature plots with a set of positional genes at E12 (see Figure 8C for expression at E18). (B) In situ hybridization for FGF8 and PSCA at E16, showing co-expression of FGF8 and PSCA at the high acuity area (area centralis). The PSCA+ domain is broader than the FGF8 domain (arrowheads). Bar, 20 µm. (C) Schematic representation for expression of PSCA, FGF8, and TMEM123. Between E12 and E20, TMEM123 is progressively restricted to peripheral retina and is then downregulated; FGF8 is present in central retina then downregulated; and PSCA appears in central retina between E14 and E16.