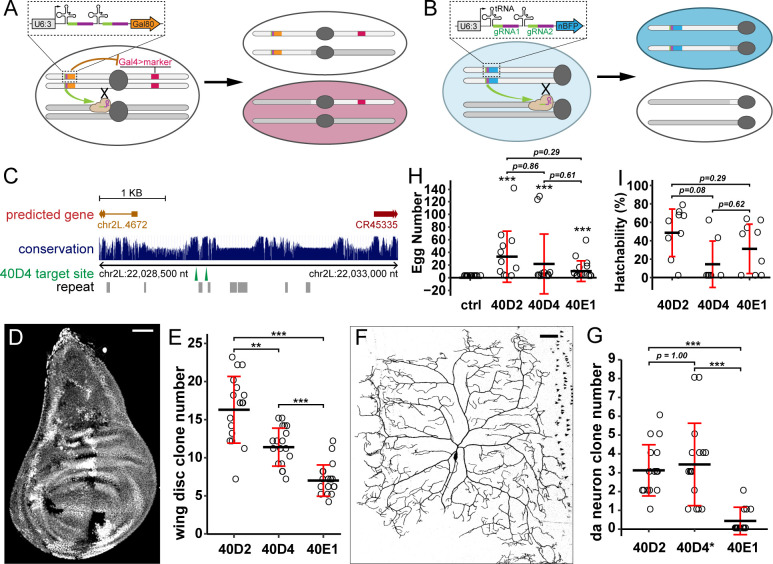
Fig 2. A toolkit for generating labeled clones for genes on chromosome arm 2L.
(A) Strategy of pMAGIC for generating positively labeled clones for genes on 2L using Gal80. (B) Strategy of nMAGIC for genes on 2L using nuclear BFP marker. (C) A map for gRNA-(40D4) target sites derived from the UCSC Genome Browser. The height of the blue bar corresponds to the level of conservation among 23 Drosophila species. The locations of predicted genes (thick line, exon or mature RNA; thin line, intron; arrow, gene orientation), repeated DNA sequences (gray boxes), gRNA target sites (green arrowheads), and chromosomal coordinates are indicated. (D) A wing imaginal disc showing twin-spot clones generated by gRNA-40D2(nBFP) paired with hh-Cas9. (E) Number of clones in wing discs using 3 different gRNA(nBFP) constructs. n = number of discs: 40D2 (n = 17); 40D4 (n = 18); 40E1 (n = 18). **p ≤ 0.01, ***p ≤ 0.001; Welch ANOVA and Welch t tests, p-values corrected using Bonferroni method. (F) A C4da neuron clone generated by gRNA-40D2(Gal80) paired with SOP-Cas9 and ppk>CD4-tdTom. (G) Quantification of C4da clones using 3 different gRNA(Gal80) constructs. n = number of larvae: 40D2 (n = 16); 40D4 (n = 16); 40E1 (n = 16). Clones were visualized by ppk>CD4-tdTom. ***p ≤ 0.001; Welch ANOVA and Welch t tests, p-values corrected using the Bonferroni method. The asterisk on 40D4 indicates frequent labeling of C3da clones. (H) Number of eggs produced by using ovoD1(2L), nos-Cas9, and 3 different gRNA(nBFP) constructs. The ctrl has no gRNA. n = number of females: ctrl (n = 13); 40D2 (n = 12); 40D4 (n = 12); 40E1 (n = 14). Asterisks are from post hoc single sample t tests that compare the EMM of each gRNA against the control (μ = 0); ***p ≤ 0.001. p-Values are from contrasts of EMMs of each gRNA (excluding control). EMMs are based on a negative binomial model. All p-values were corrected using the Tukey method. (I) Hatchability of eggs produced by females carrying ovoD1(2L), nos-Cas9, and gRNA(nBFP) constructs. n = number of females: 40D2 (n = 9); 40D4 (n = 7); 40E1(n = 9). p-Values are from contrasts of EMMs of proportions of hatched/nonhatched eggs for each gRNA based on a binomial, mixed-effects model and were corrected using the Tukey method. For E, G, and H: black bar, mean; red bar, SD. Scale bars, 50 μm. The data underlying this Figure can be found in S1 Data. BFP, blue fluorescent protein; ctrl, control; EMM, estimated marginal mean; gRNA, guide RNA; nBFP, nuclear blue fluorescent protein; nMAGIC, negative MAGIC; pMAGIC, positive MAGIC.

