
Figure 5.
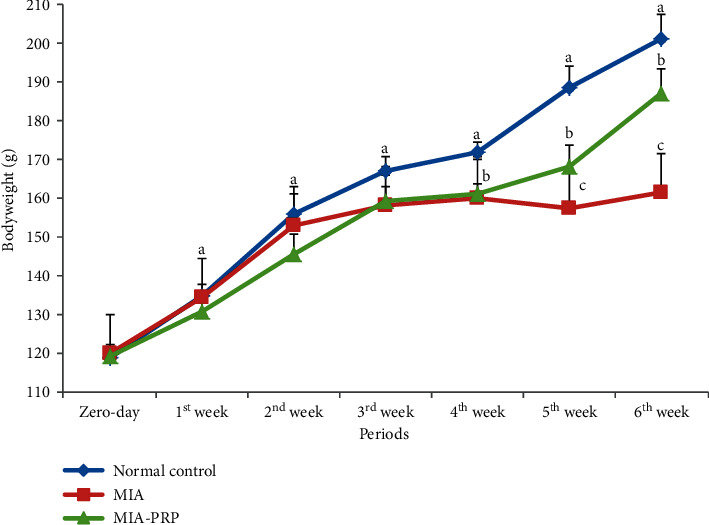
Bodyweight changes in normal control, MIA, and MIA-PRP groups. At each period, the means, which have different symbols (letters), are significantly different at p < 0.05.
Official websites use .gov
A
.gov website belongs to an official
government organization in the United States.
Secure .gov websites use HTTPS
A lock (
) or https:// means you've safely
connected to the .gov website. Share sensitive
information only on official, secure websites.
Bodyweight changes in normal control, MIA, and MIA-PRP groups. At each period, the means, which have different symbols (letters), are significantly different at p < 0.05.