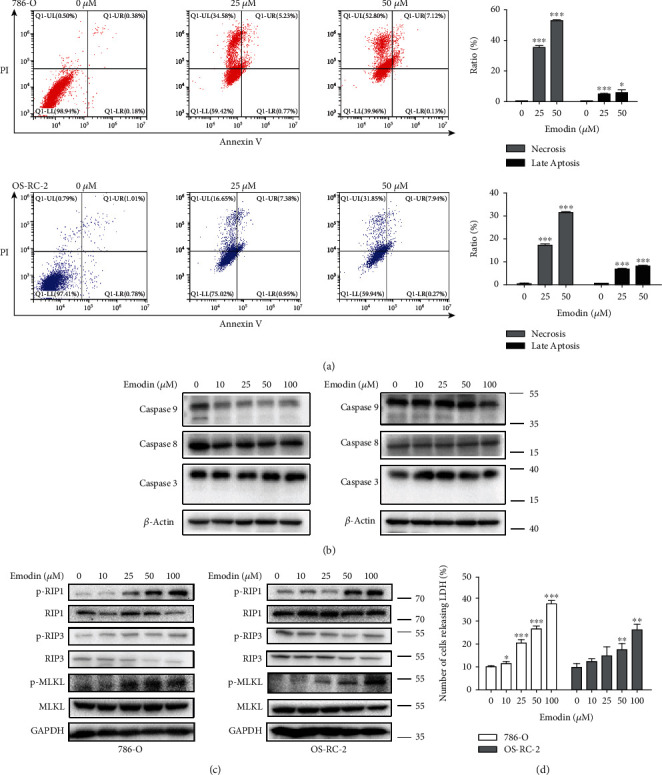
Figure 2.

Emodin induced renal cancer cell death. (a) Different concentrations of emodin induce necrosis and apoptosis in 786-O and OS-RC-2 cells. Representative density plots of flow cytometric analysis on the fraction of dead cells 24 h after the indicated treatments detected with Annexin V/propidium iodide. The histogram represents the mean values of three independent experiments. (b) Caspase 9, caspase 8, and caspase 3 protein levels in the described cell lines were determined using western blot analysis. (c) p-RIP1, p-RIP3, and p-MLKL protein levels in the described cell lines were determined using western blot analysis. (d) LDH release tests in 786-O and OS-RC-2 cells after 24 h of treatment with emodin.
