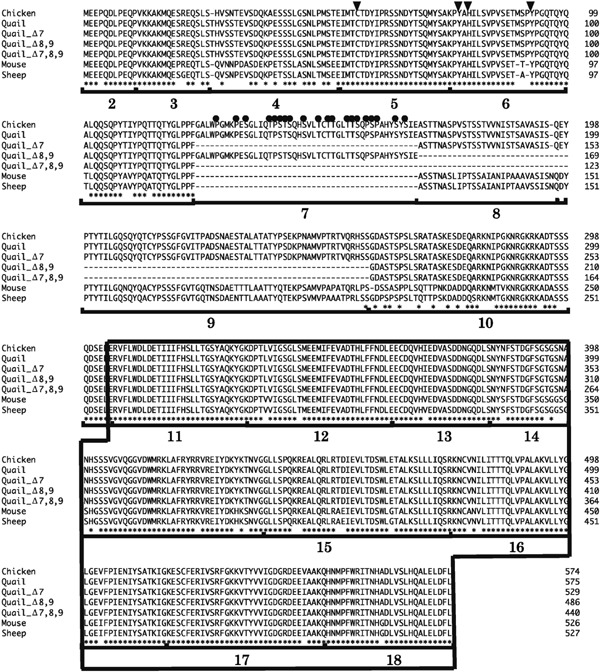
Fig. 1.

Comparison of amino acid sequences of Eya3 in chicken, quail, mouse, and sheep. Asterisks indicate identical amino acids. The arrowheads indicate potential residues, Cys-56, Tyr-77, His-79, and Tyr-90, involved in the threonine–phosphatase activity of mouse Eya3. The black circles indicate proline, serine, and threonine in exon 7. Boxed region indicates the Eya domain (ED). Bold numbers indicate the number of exons, referenced from the chicken ensemble database.
