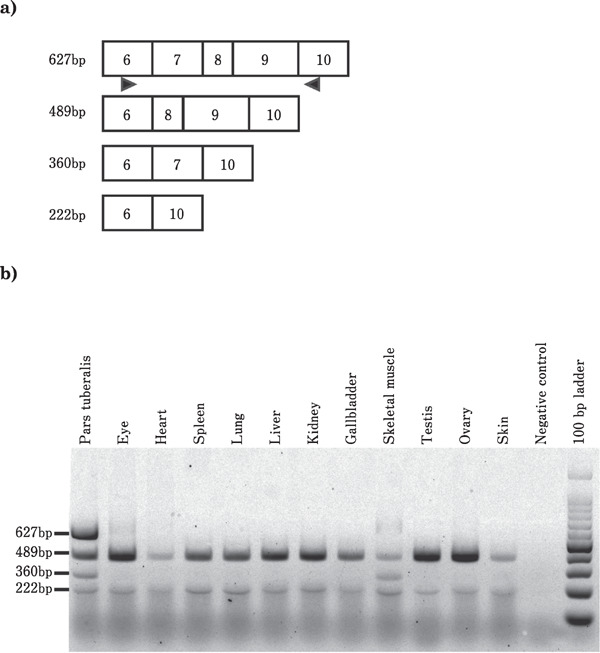
Fig. 2.

Expression profiles of EYA3 mRNA splice variants in quail tissues analyzed by RT-PCR. PCR was performed to amplif yregions from exons 6 to 10 of EYA3 mRNA under the 1LD condition. a: Schematic representation of the cDNA structure of EYA3 mRNA splice variants. Boxed region indicates the exon. The numerals in the box indicate the number of exons. The 627 bp, 489 bp, 360 bp, and 222 bp indicate amplified cDNA size. The arrowheads show the position of primers used for PCR. b: Tissue distribution of splice variants determined using 1.5% gel electrophoresis. bp indicates base pair.
