Figure 1.

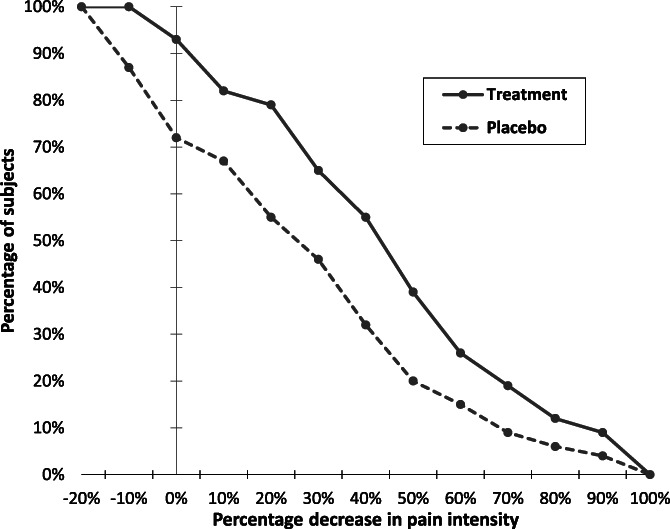
Empirical cumulative distribution functions for percentage changes from baseline ranging from small degrees of worsening through all possible degrees of improvement (reproduced from ref. 187).

Empirical cumulative distribution functions for percentage changes from baseline ranging from small degrees of worsening through all possible degrees of improvement (reproduced from ref. 187).