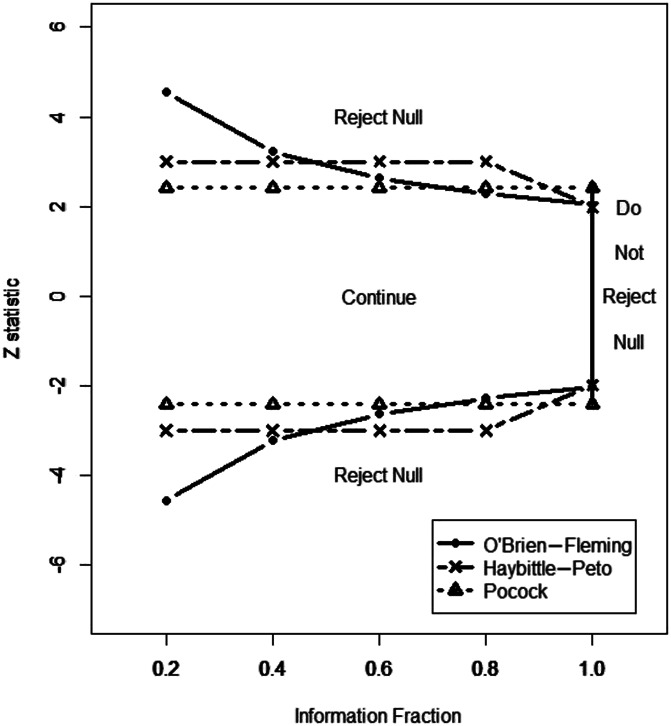
Figure 3.

Illustration of 3 types of 2-sided efficacy boundaries for group sequential designs for a comparison of 2 groups. It is assumed that the test statistic (Z) is approximately normally distributed, and an overall 5% significance level is used. Interim analyses are to be performed after the primary outcome variable is available for 20%, 40%, 60%, 80%, and 100% of the enrolled subjects. At each interim analysis, if the Z statistic falls above the upper boundary or below the lower boundary, the null hypothesis of no treatment group difference is rejected; otherwise, the trial is continued.
