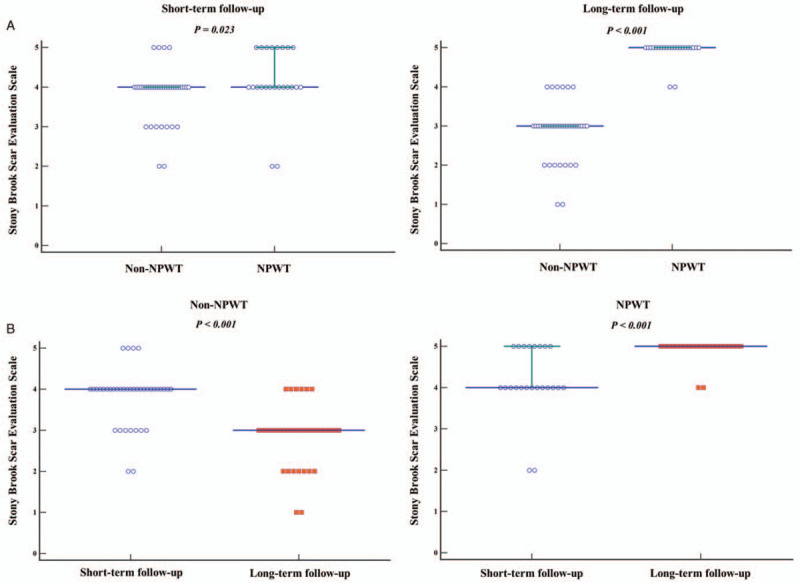
Figure 3.

A) Comparison of the Stony Brook Scar Evaluation Scale results between Non-NPWT and NPWT groups using the Mann–Whitney U-test. Solid lines indicate the median values with interquartile ranges. B) Comparison of the Stony Brook Scar Evaluation Scale between short and long-term follow-up evaluations for each group using the Wilcoxon signed-rank test. Solid lines indicate median values with interquartile ranges. Circles indicate the short-term follow-up outcomes, whereas squares indicate long-term follow-up outcomes based on the scores of the scar evaluation scale. NPWT, negative pressure wound therapy.
