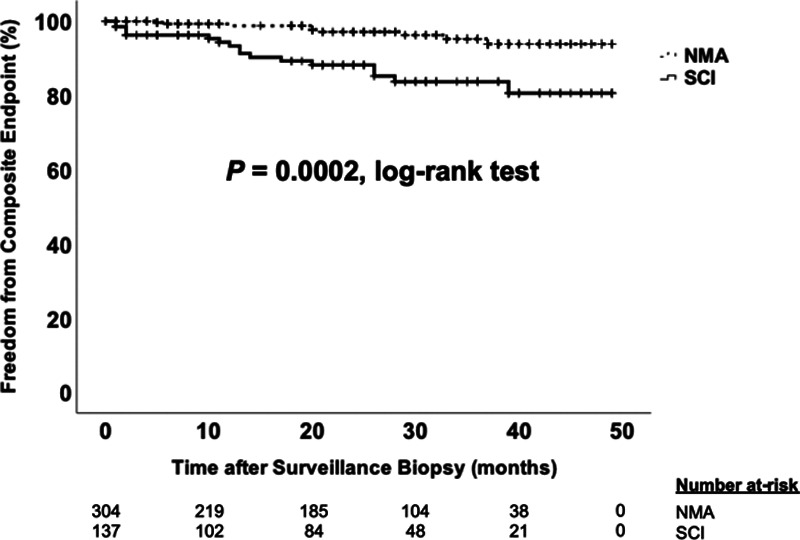
FIGURE 1.

Time to composite endpoint according to presence of subclinical inflammation (SCI). Kaplan-Meier plot comparing time to the composite endpoint between the SCI group and the no major surveillance abnormalities (NMA) group using the log-rank test. Hatch marks represent censored cases in each group.
