
FIGURE 3.
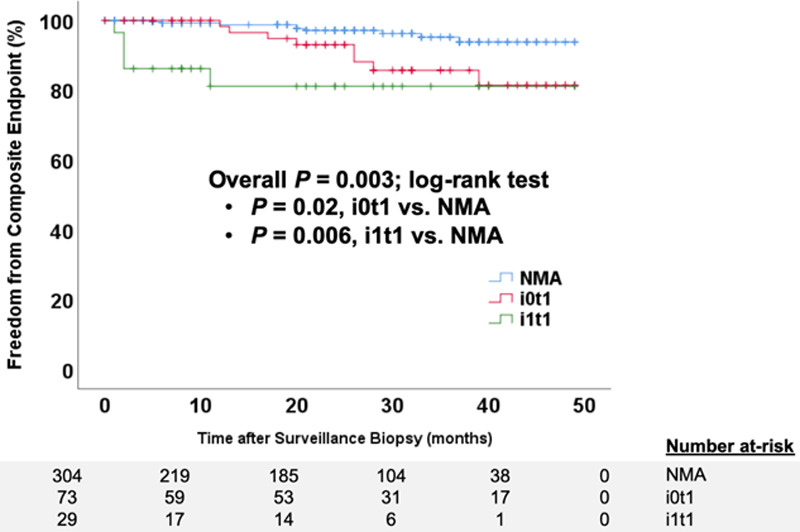
Time to composite endpoint according to different thresholds for subclinical borderline T cell-mediated rejection (TCMR). Kaplan-Meier plot comparing time to the composite endpoint between subclinical borderline TCMR cases diagnosed with an i1t1 threshold, subclinical borderline cases with an i0t1 threshold, and cases with no major surveillance abnormalities (NMA) by the log-rank test. Hatch marks represent censored cases in each group.