Figure 1.

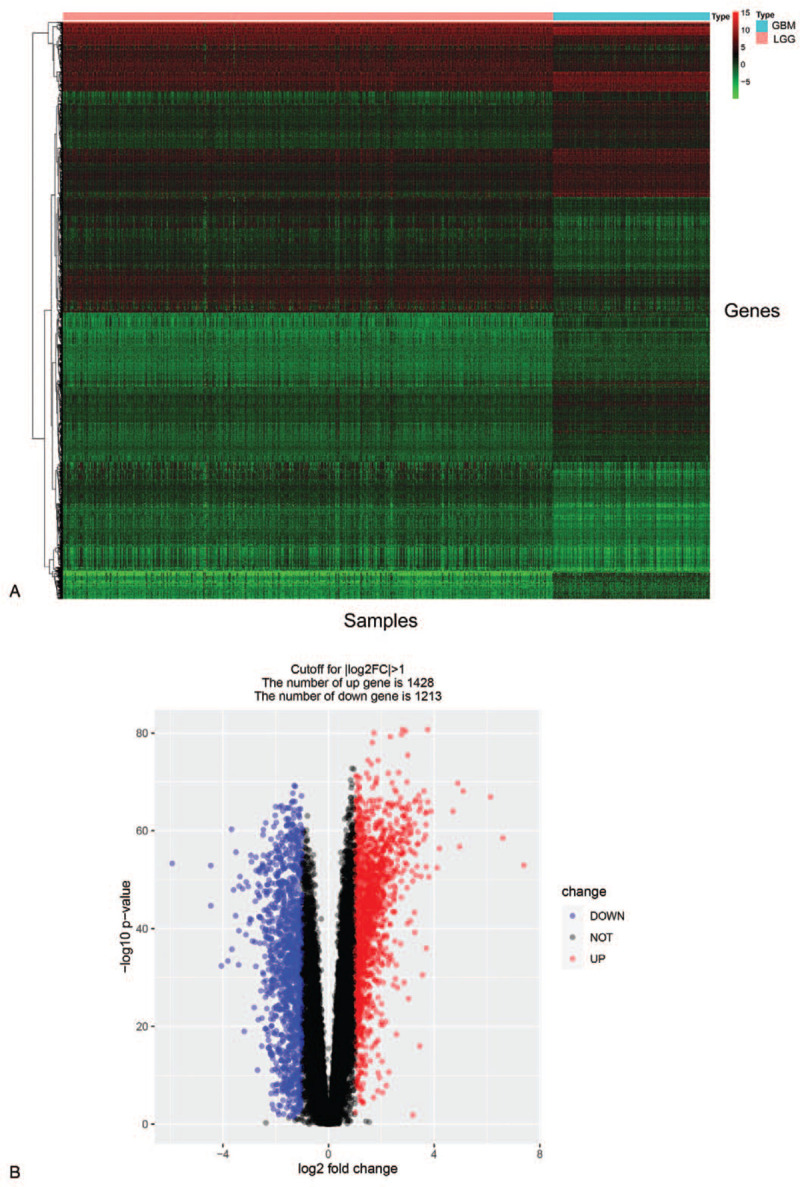
Identification of expression differences between LGG and GBM. (A) Heat-map overview of the differentially expressed genes. (B) Volcano plot of the differential mRNA expression analysis.

Identification of expression differences between LGG and GBM. (A) Heat-map overview of the differentially expressed genes. (B) Volcano plot of the differential mRNA expression analysis.