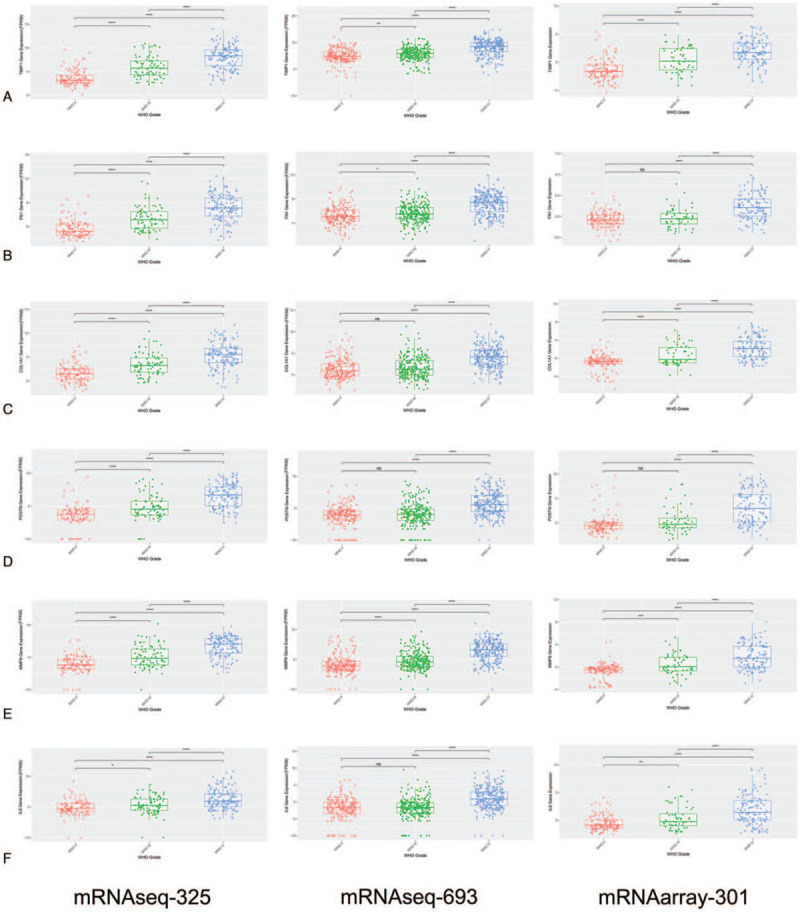
Figure 7.

The hub genes mRNA expression levels in CGGA database. (A) TIMP1; (B) FN1; (C) COL1A1; (D) POSTN; (E) MMP9; (F) CXCL8. Differences between groups were analyzed by the Student t test, ∗P < 0.05; ∗∗P < 0.01, ∗∗∗P < 0.001, ns, not significant.
