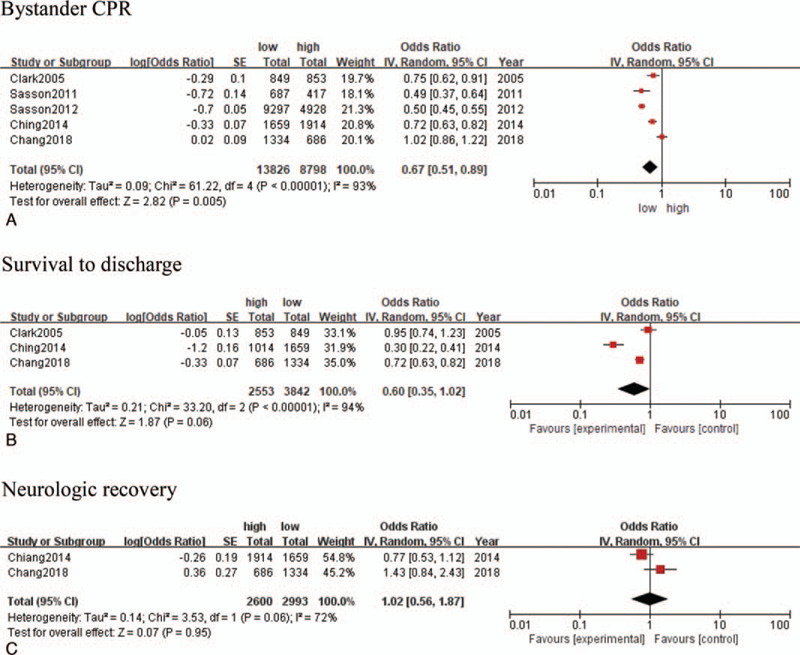
Figure 2.

Forest plots for outcomes with low socioeconomic status (SES) communities compared with high SES communities of economic SES indicators. A: bystander CPR; B: survivals to discharge; C: neurologic recovery. CI = confidence interval, CPR = cardiopulmonary resuscitation, IV = inverse variance, SE = standard error, SES = socioeconomic status.
