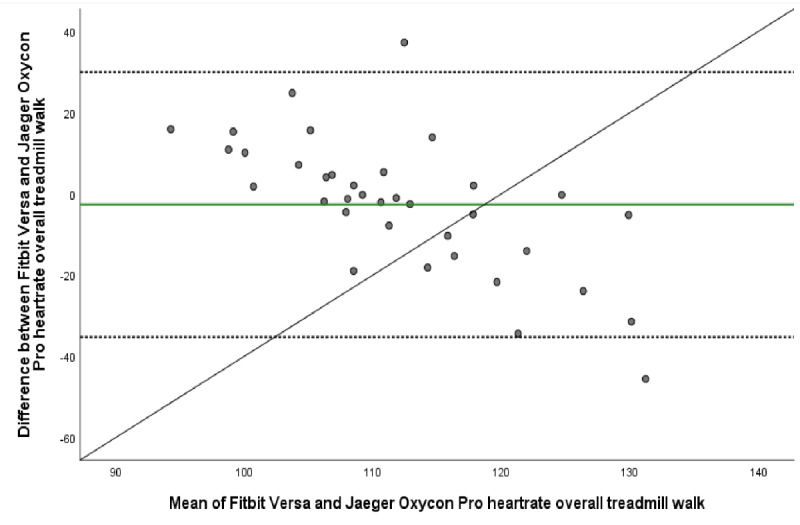
Figure 2.

Bland-Altman plot visualizing agreement of heartrate estimated by Fitbit Versa and criterion measurement Jaeger Oxycon Pro during overall treadmill walk. The middle green line shows the mean difference (bias) between devices. The dashed lines indicate upper (+1.96 SD) and lower (–1.96 SD) limits of agreement and the black line represents the regression line illustrating association between estimations.
