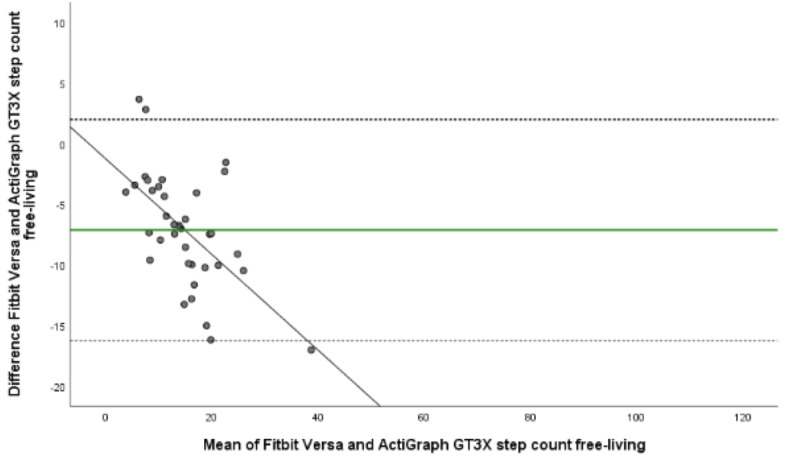
Figure 5.

Bland-Altman plot visualizing agreement of step count estimated by Fitbit Versa and relative criterion measurement ActiGraph GT3X during free-living. The middle green line shows the mean difference (bias) between devices. The dashed lines indicate upper (+1.96 SD) and lower (–1.96 SD) limits of agreement and the black line represents the regression line illustrating association between estimations.
