Table 3.
Inhibition rates and in vitro anti-proliferative activity of compounds 19a‒v.
| No. | R6 | R7 | n2 | Inhibition rate (1 μmol/L/10 μmol/L, %)a |
Anti-proliferative activity (IC50, μmol/L)b |
|||
|---|---|---|---|---|---|---|---|---|
| PARP1 (μmol/L) |
BRD4 (μmol/L) |
|||||||
| 1 | 10 | 1 | 10 | |||||
| RVX-208 | – | – | – | 1 | 4 | 20 | 60 | >30 |
| Olaparib | – | – | – | 100 | 100 | – | – | 1.1 ± 1.4 |
| 19a | Cl |  |
2 | 30 | 85 | 31 | 90 | 6.0 ± 0.9 |
| 19b | Cl |  |
3 | 35 | 81 | 3 | 69 | 10.9 ± 0.5 |
| 19c | Cl |  |
4 | 29 | 84 | 7 | 54 | 7.4 ± 1.8 |
| 19d | H |  |
2 | 37 | 88 | 69 | 92 | 3.4 ± 1.1 |
| 19e | Cl |  |
5 | 18 | 71 | 4 | 55 | 15.3 ± 3.6 |
| 19f | 3,5-diCH3 |  |
2 | 40 | 79 | 11 | 74 | 8.4 ± 1.3 |
| 19g | 3,5-diOCH3 |  |
2 | 25 | 70 | 15 | 72 | 5.7 ± 2.1 |
| 19h | 2-F |  |
2 | 31 | 65 | 12 | 62 | 11.8 ± 3.4 |
| 19i | 3,5-diCH3 | 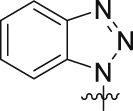 |
2 | 11 | 18 | 18 | 61 | >30 |
| 19j | 3,5-diOCH3 |  |
2 | 6 | 18 | 12 | 64 | >30 |
| 19k | H |  |
2 | 7 | 29 | 13 | 83 | 22.9 ± 2.4 |
| 19l | 3-F |  |
2 | 1 | 14 | 29 | 80 | 23.7 ± 3.3 |
| 19m | 3,5-diCH3 | 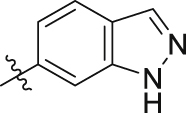 |
2 | 7 | 11 | 15 | 46 | >30 |
| 19n | 3,5-diOCH3 |  |
2 | 9 | 16 | 14 | 45 | >30 |
| 19o | H |  |
2 | 3 | 13 | 3 | 56 | >30 |
| 19p | 3-Cl | 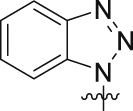 |
2 | 3 | 6 | 3 | 44 | >30 |
| 19q | OCH3 |  |
2 | 3 | 2 | 11 | 80 | 24.2 ± 2.2 |
| 19r | Cl |  |
2 | 4 | 6 | 17 | 77 | >30 |
| 19s | F | 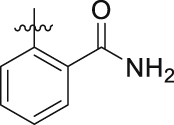 |
2 | 12 | 65 | 8 | 74 | 8.7 ± 5.2 |
| 19t | H | 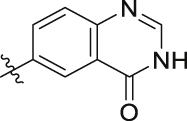 |
2 | 1 | 25 | 9 | 67 | >30 |
| 19u | H | 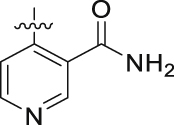 |
2 | 36 | 81 | 6 | 77 | 6.7 ± 2.4 |
| 19v | H |  |
1 | 19 | 51 | 29 | 60 | – |
‒Not applicable or not test.
Each compound was tested in duplicate, the average value was obtained.
IC50 values were obtained with cell viability assay for 24 h.

