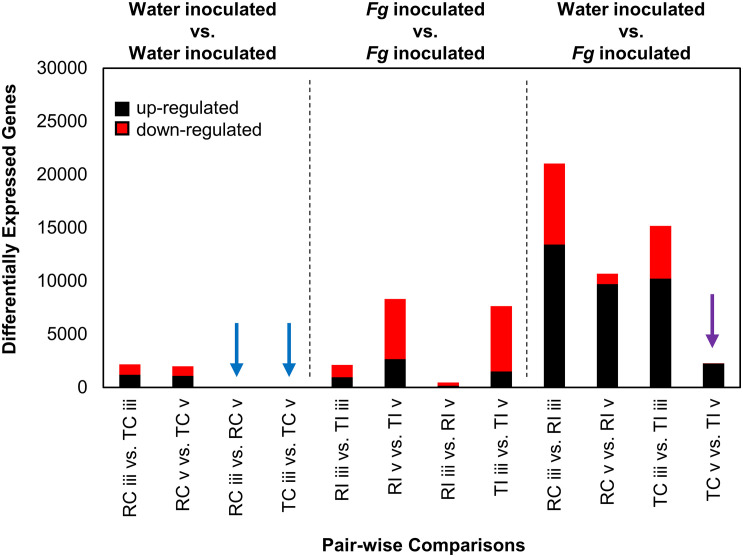
FIGURE 3.
DEGs from Fg and water inoculated samples of AAC Tenacious and Roblin. The number of DEGs (both up- and down-regulated) in each pair-wise comparison are shown. Conditions are abbreviated to two letter labels where the first letter is the cultivar (Roblin is “R” and AAC Tenacious is “T”), the second letter indicates the inoculum (Fg inoculated is “I” and the water control is “C”), which is followed by the tissue section (POI is “iii” and adjacent spikelet is “v”). Comparisons between water control samples are indicated (left), with comparisons with no differentially expressed genes indicated by blue arrows. Comparisons between Fg inoculated conditions are also shown (middle). Comparisons between Fg and water inoculations are indicated (right), where purple indicates comparisons between AAC Tenacious Fg inoculated and water controls samples at section “v.” Depending on the comparison, up-regulated genes are considered to have increased expression in the Fg inoculated sample, AAC Tenacious, or “section v”.

