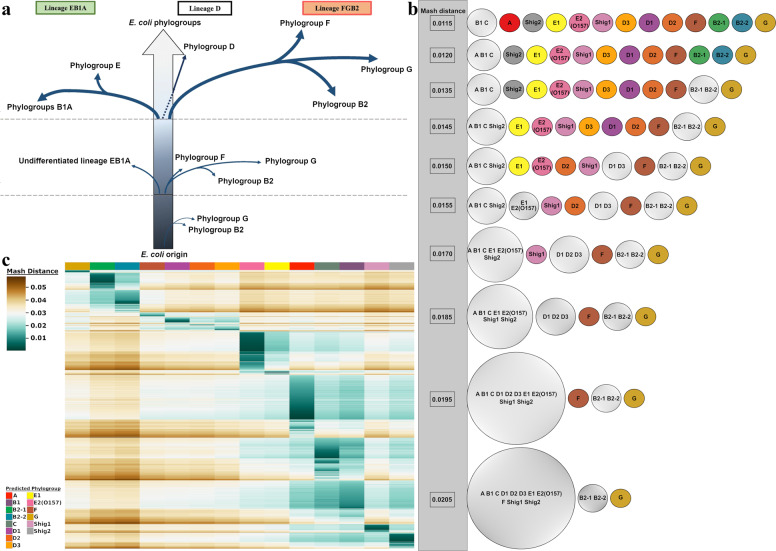
Fig. 2. Summary of phylogroup differentiation and heatmap representation of sequence reads from the SRA database.
a Evolutionary scenario in the diversification of E. coli adapted from Gonzalez-Alba et al.19, based on their methodology “SP-mPH,” a combination of “stratified phylogeny” and “molecular polymorphism hallmark.” Each branch reflects SNPs accrued by each phylogroup over time. Branch length is not proportional to the observed evolutionary distance. b Summary of the Cytoscape analysis. Phylogroups are colored based on the same color scheme in Fig. 1. Phylogroups with more than one member are gray colored. The Mash distance at which each division occurs at is indicated by numerical value in the gray bar that runs down the side of this panel. c Clustered heatmap of 91,260 unassembled sequence reads. The heatmap colors are based on the pairwise Mash distance between the SRA read sets and the 14 medoid genomes, one for each phylogroup, which are presented in the same order as in Fig. 1. To be included, SRA reads sets had to have three or more medoid comparisons producing a Mash distance equal to or less than 0.04. This removed 4265 SRA read sets from the dataset. The number of SRA reads mapped to each medoids is given below the heatmap. Additional heatmaps of the SRA data can be found in Supplementary Figs. 3–16.

