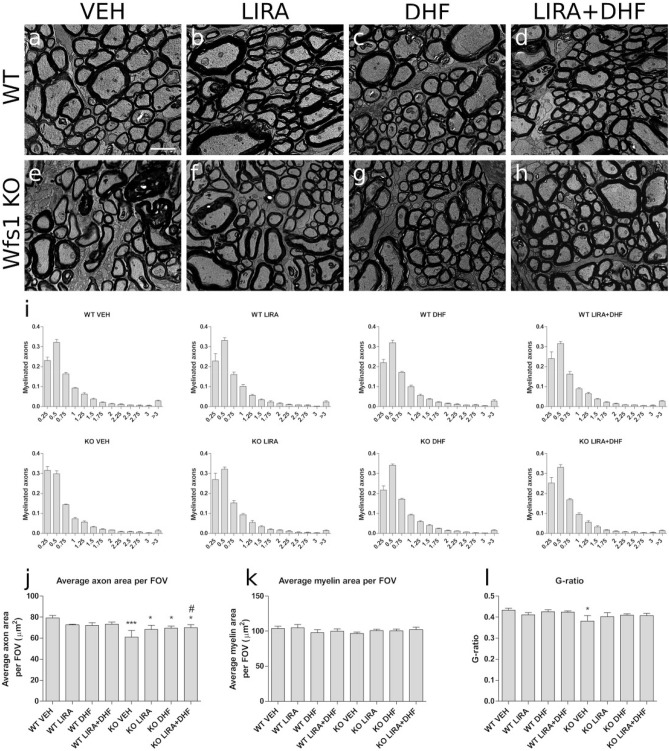
Figure 3.
3.5-month treatment with liraglutide, 7,8-DHF or with their combination delayed the progression of optic nerve atrophy in Wfs1 KO animals. Electron micrographs representing cross-sections from analyzed (a–d) WT and (e–h) Wfs1 KO rat’s optic nerves from corresponding treatments, liraglutide (LIRA), 7,8-DHF (DHF) or liraglutide and 7,8-DHF (LIRA + DHF). (i) Optic nerve axon size distribution in every treatment group, (j) average axon area per field of view (FOV), (k) average myelin area per FOV, (l) G-ratios calculated as total axonal area divided by total axonal area plus myelin area. Quantitative data were compared using factorial ANOVA followed by Fisher’s LSD tests; *p < 0.05; ***p < 0.001 compared to WT vehicle animals and # p < 0.05 compared to KO Sal animals. The data are presented as the mean ± SEM, n = 4–7 per group. Scale bar: 2 μm.

