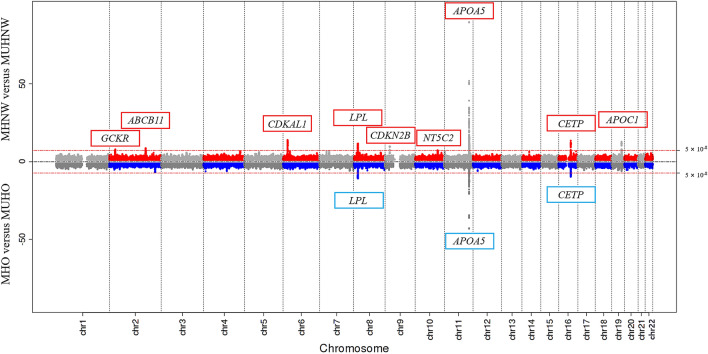
Figure 1.
Miami plot of the GWASs for model 1 (MHNW versus MUHNW) and model 2 (MHO versus MUHO). SNP locations are plotted on the x-axis according to their chromosomal position. The −log10(p-values) derived from the logistic regression analysis are plotted on the y-axis. The p-values were adjusted for age, sex, exercise status, smoking status, alcohol intake, body mass index, and PC1 and PC2. The horizontal red line indicates the formal threshold for genome-wide significance at p = 5.00 × 10⁻⁸. GWASs, genome-wide association studies; MHNW, metabolically healthy normal weight; MUHNW, metabolically unhealthy normal weight; MHO, metabolically healthy obese; MUHO, metabolically unhealthy obese; PC, principle component; SNP, single-nucleotide polymorphism. The figure was generated using EasyStrata version 8.6 (http://www.genepi-regensburg.de/easystrata).

