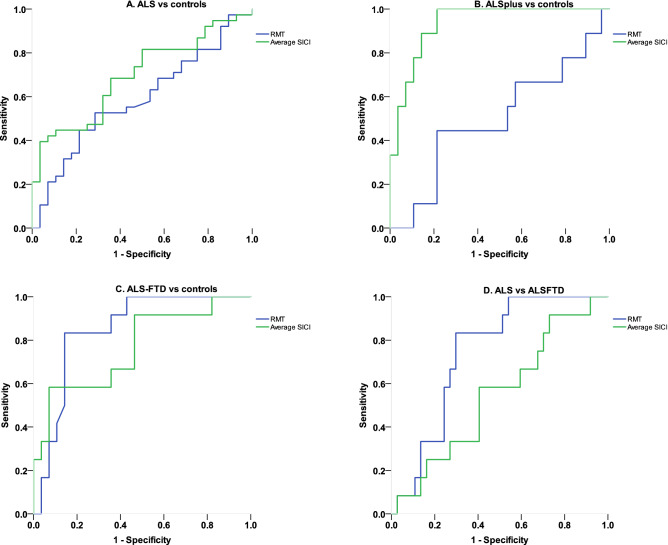
Figure 2.
Receiving operating characteristic (ROC) curves for differentiating ALS, ALS-Cog and ALS-FTD from controls. (A) Receiver operating characteristic (ROC) curves for differentiating ALS from healthy controls with area under the curve (AUC = 0.586, p = 0.233 for RMT and AUC = 0.695, p = 0.007 for average SICI) (B) ROC curves for differentiating ALS-Cog from healthy controls with area under the curve (AUC = 0.500, p = 1 for RMT and AUC = 0.933, p < 0.001 for average SICI) (C) ROC curves for differentiating ALS-FTD from healthy controls with area under the curve (AUC = 0.850, p = 0.001 for RMT and AUC = 0.765, p = 0.009 for average SICI) 2D) ROC curves for differentiating ALS from ALS-FTD with area under the curve (AUC = 0.745, p = 0.011 for RMT and AUC = 0.547, p = 0.625 for average SICI).

