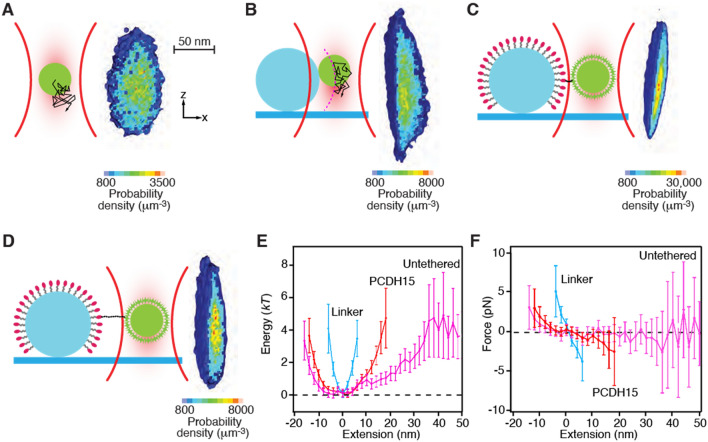
Figure 2.
Determination of the pedestal's position and trap's strength. (A) A schematic diagram (left) portrays the thermal diffusion of the probe in an optical trap. A section through the experimentally measured three-dimensional probability density (right) reveals the positions explored by the diffusing probe. The distribution is roughly symmetrical along the x- and y-axes, but elongated owing to weaker trapping along the z-axis. Note the discrepancy in scale: the density distribution is magnified about 25X in comparison to the 1 μm probe. The arrangements, definitions of axes, and spatial scales are identical in the following three panels. (B) When the probe is brought into contact with the fixed pedestal, its diffusion is restricted. Flattening of the experimental probability density demarcates the surface of the pedestal. (C) When the probe is affixed to the PEG-coated pedestal by a short linker, the linker further restricts diffusion of the probe. (D) In an actual experiment, the probe is attached to the pedestal by a PCDH15 monomer. The protein's extensibility allows the probe to explore a larger volume of space. (E) The experimentally determined probability distributions reflect the energy of the system for the probe at various positions. (F) The slopes of the displacement-energy relations in panel (E) represent the forces exerted on the probe by the optical trap and tethers. In both panels, the error bars show standard deviations calculated by means of correlated counting statistics20, a technique used to estimate the errors for correlated datasets such as these. The occupancy counts range from 60 to 110 in the central regions of each dataset to one to three counts for the most extreme points.

