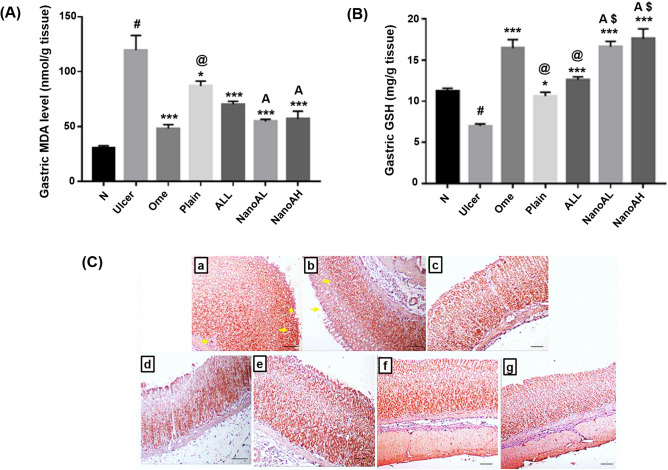
Figure 11.
Oxidative status of (A) gastric MDA (nmol/g tissue) and (B) gastric GSH (mg/g tissue) in rats’ gastric tissues. (C) Immunostaining of Nrf-2 in rats’ gastric tissues (X: 100). (a) N group, (b) ulcer group, (c) ome group, (d) plain group, (e) ALL group, (f) NanoAL group, and (g) NanoAH group. X: 100. Data are expressed as mean ± SEM, #p < 0.001 compared to N group, *p < 0.05 compared to ulcer group, ***p < 0.001 compared to ulcer group, @p < 0.01 compared to ome group, $p < 0.001 compared to ALL group, Ap < 0.05 compared to plain group using GraphPad Prism 5.00 (http://www.graphpad.com). Positive stainings are shown by yellow arrow.

