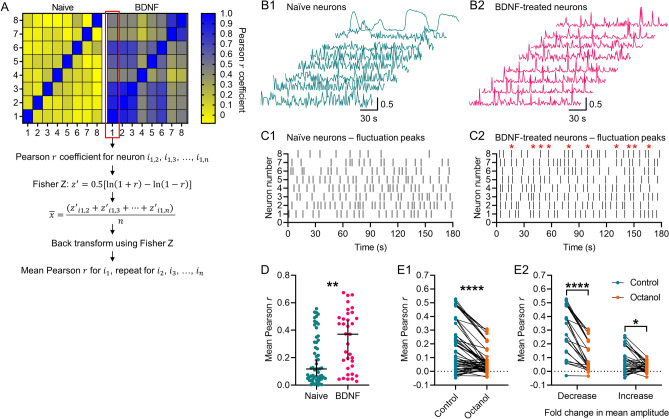
Figure 3.
Synchrony of [Ca2 +]i fluctuations in BDNF-treated cultures and the effect of octanol. (A) Example adjacency matrix constructed from Pearson r coefficients corresponding to the correlation in activity between neurons in a naïve or BDNF-treated culture, each with 8 sampled neurons. Steps to calculate the mean Pearson r for each neuron within a culture using the Fisher Z transformation are also depicted. (B1,B2) Example recordings of asynchronous [Ca2+]i fluctuations in naïve neurons and synchronous [Ca2+]i fluctuations in BDNF-treated neurons. Recordings shown were processed by FIBSI for event detection and each one was normalized (0 to 1 scale) before calculation of the adjacency matrix in A. (C1,C2) Raster plots depicting the fluctuation peak times detected by FIBSI for the recordings in B1-B2. Red stars in C2 denote the presence of synchronous waves of [Ca2+]i activity. (D) Neurons sampled from BDNF-treated cultures exhibited significantly greater mean Pearson r coefficients compared to neurons sampled from naïve cultures. Neurons were imaged from 4 naïve cultures and 3 BDNF-treated cultures, each with ≥ 8 neurons imaged. Medians shown with the 95% confidence interval. Medians were compared using a Mann–Whitney test. (E1,E2) Treatment with octanol significantly decreased the mean Pearson r in neurons sampled from cultures exposed to chronic BDNF, and this treatment effect impacted both subsets of neurons binned based on their initial response to octanol. Neurons were imaged from 4 cultures. The control vs octanol paired comparison in C1 was made using a Wilcoxon rank sum test. Control vs octanol paired comparisons for the groups in C2 were made using a measures two-way repeated measures ANOVA and Sidak’s post-hoc test. *P < 0.05, **P < 0.01, ****P < 0.0001.

