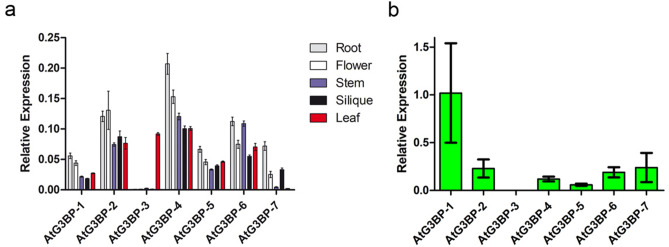
Figure 5.
Expression level analyses. (a) qRT-PCR was used to measure the relative gene expression of the different AtG3BPs in roots, stem, flower, silique, and rosette leaves. Transcript levels were calculated using the 2-∆Ct method with AtActin-2 as the endogenous control. The error bar represents the standard error. (b) Expression ratio of AtG3BP genes in phloem tissue compared to non-phloem tissue in A. thaliana leaves extracted by laser dissection of AtSUC2promoter::GFP plants. Gene expression was normalized to AtActin-2 and expression levels were calculated using the 2−∆Ct method.

