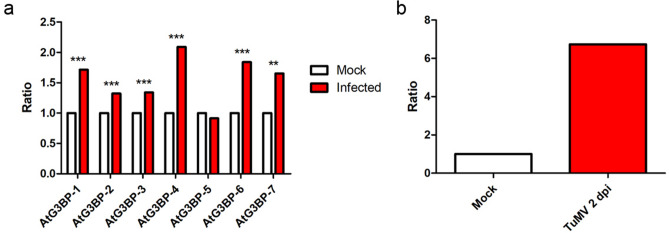
Figure 6.
Expression level analyses. (a) Transcript abundance in TuMV-infected leaf tissue was measured and compared to non-infected tissue to determine the regulation of the expression level of the different AtG3BPs, AtActin-2 served as the internal control. The asterisks indicate significance measured by two-tailed t-test (** = p < 0.01; *** = p < 0.005) (b) qRT-PCR analysis for verification of RNAseq data. AtG3BP-4 expression level in TuMV infection sites 2 dpi was measured and compared to mock-inoculated tissue.

