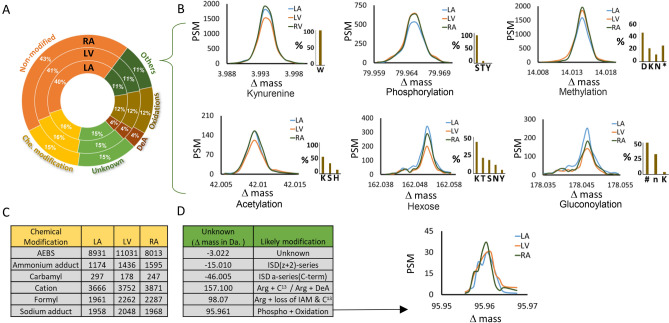
Figure 3.
Classification of peptide modifications across three cardiac chambers. (A) Pie chart representation of the distribution of identified peptides that were either without a modification (Non-modified), with a chemical modification (Che. modification), a post translational modification (Others, Oxidations, DeA) or with an unknown modification (Unknown). Percentage distributions are shown for each of the three heart chambers (Circular bar graphs: RA, LV, LA). (B) Frequency distributions of the occurrence of six biological modifications across the three cardiac chambers. The modifications shown are: Kynurenine, Phosphorylation, Methylation, Acetylation, Hexose/Glycosylation and Gluconoylation. Next to each frequency plot, a bar graph shows the amino acids affected by the modification in percentage. (C) Table showing the most common chemical modifications identified in the dataset and the number of peptides carrying the modifications in each of the three chambers of heart. (D) Table showing the most frequent unknown mass shifts in the dataset along with a likely explanation of them from PTM-Sticker and PTM-Shepherd. To the right of the table, a frequency plot for the mass shift explained by combination phosphorylation and oxidation is shown.

