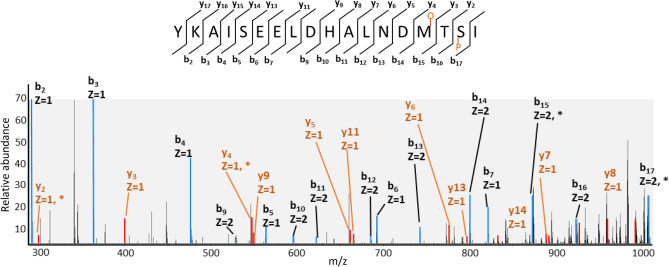
Figure 4.
Fragmentation spectra of peptide with two PTMs: phosphorylation and oxidation. Highlighted peaks represent peptide fragments. b-ions show fragments from the peptide N-terminus side (blue) and y-ions show fragments from the peptide C-terminus (orange). Fragments with modifications are highlighted with *: b15, b17, y2 and y4. The peptide is oxidated on methionine and phosphorylated on serine. The inset figure at the top shows all fragment ions detected.

