
Fig. 3. Variations of aspartate and serine enantiomer levels in serum of healthy subjects and AD patients at different stages of the disease.
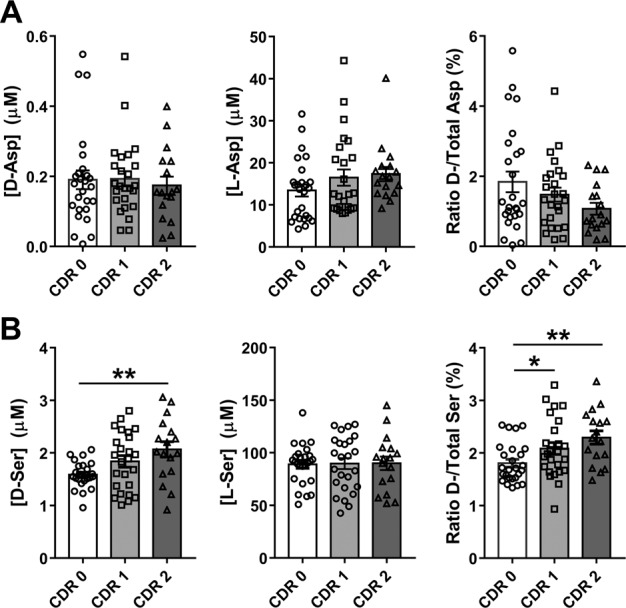
d- and l-Asp (A left and center, respectively) and d- and l-Ser (B left and center, respectively) levels and ratio between d-enantiomer and total (d+l) amino acid content (A right and B right for Asp and Ser, respectively, expressed as percentage) detected in serum samples of AD patients compared to healthy subjects (CDR 0) related to the stage of the pathology. Dots and bars represent the single subjects’ values and the standard error of the mean, respectively. *P < 0.05; **P < 0.01 (Mann–Whitney unpaired test). Disease stage was assessed by Clinical Dementia Rating (CDR) score (see Materials and methods): CDR 0: healthy subjects; CDR 1: mild dementia; CDR 2: moderate dementia.