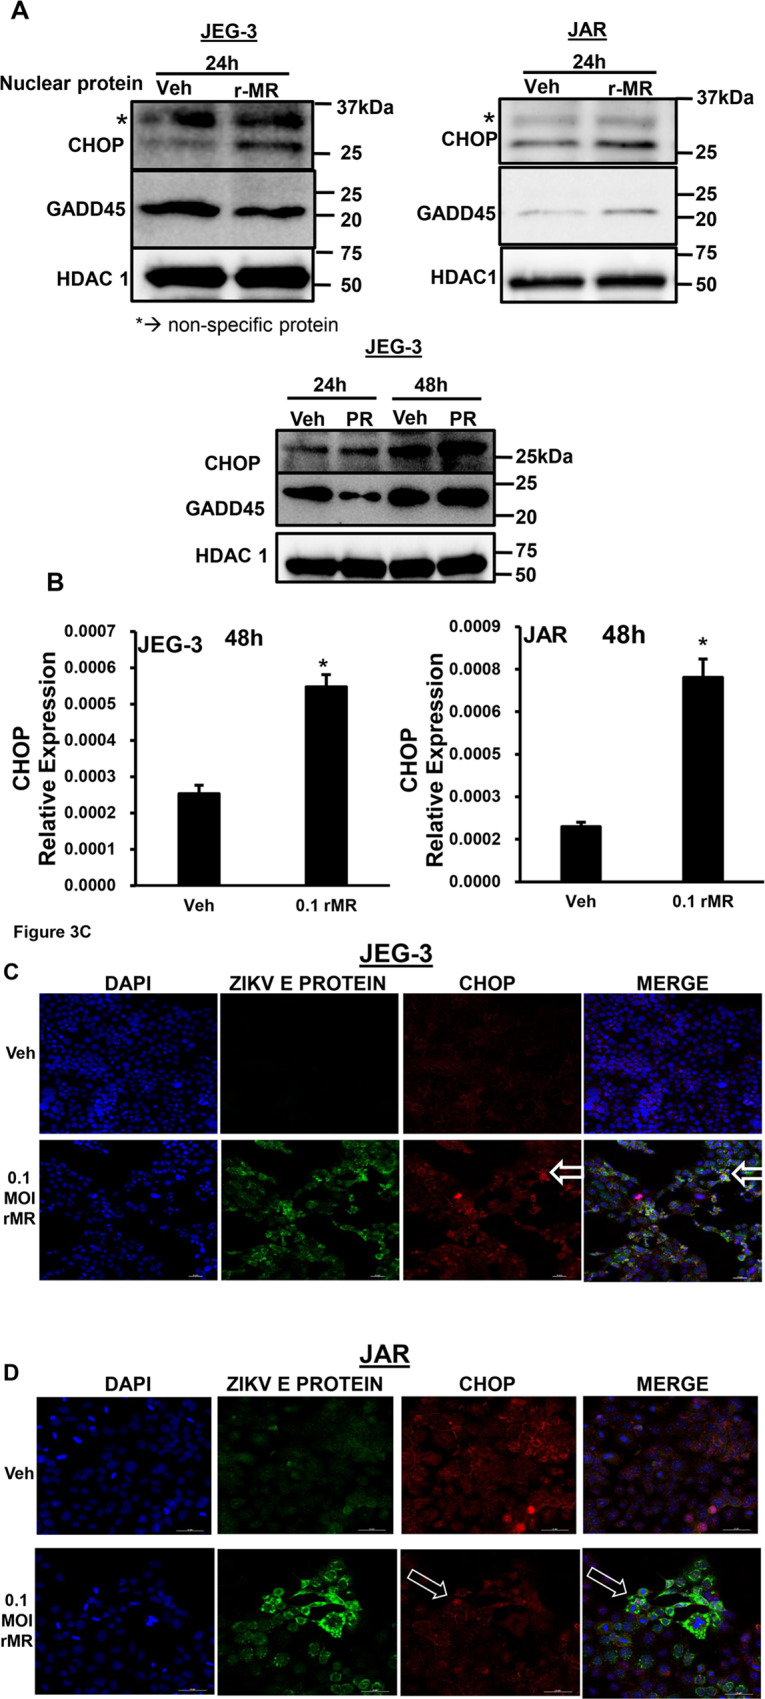
Fig. 3. ZIKV infection induces the expression CHOP, a transcription factor that activate apoptosis.

a Immunoblot analysis showed an increase in the expression of CHOP in nuclear extracts of ZIKV infected cells (0.1 MOI r-MRV) compared to vehicle uninfected cells in JEG-3 (left) and JAR cells (right), increased nuclear levels of CHOP can act as an initiator for apoptosis. JEG-3 (left) and JAR cells (right). We also observed increased GADD45 levels in nuclear protein, which is produced in response to DNA damage, after 24 h of infection in JAR cells (right) with 0.1 MOI of r-MRV compared to uninfected vehicle cells and this increase of GADD45 in the infected cells was absent in JEG-3 (left). HDAC1 was used as a loading control. We also observed increase in expression of CHOP nuclear protein both 24 and 48 h postinfection and GADD45 nuclear protein around 48 h postinfection in JEG-3 cells with 0.1 MOI PRV (lower middle panel). b JEG-3 (left) and JAR (right) cells after 48 h of 0.1 MOI of r-MRV showed significant increase in CHOP mRNA levels compared to uninfected vehicle cells. CHOP mRNA expression were reported relative to 18 S rRNA. Each value presents mean ± SEM of biological replicates (n = 3), *P < 0.05 compared to uninfected vehicle cells; statistical comparison by Student’s t-test. c Immunofluorescence analysis was also performed to test CHOP nuclear translocation by using Viral E protein staining indicated as green signal and CHOP as red signal. JEG-3 cells: uninfected vehicle cells showed no viral E protein staining but has endogenous CHOP expression. Cells infected with 0.1 MOI r-MRV show nuclear CHOP expression surrounded by viral E protein staining in the cytoplasm in the merged panel. d JAR cells: uninfected vehicle cells show no viral E protein staining but endogenous CHOP expression is seen. Cells infected with 0.1 MOI r-MRV showed increased nuclear CHOP expression surrounded by viral E protein staining in the cytoplasm showed in the merged panel indicated in white arrow. Scale bar represents 50 µM size.
