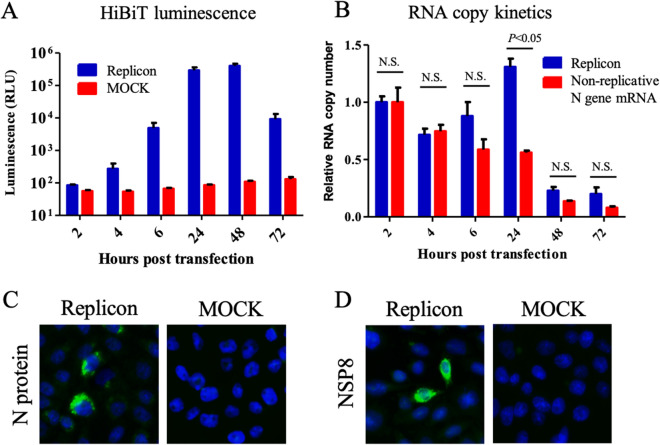
Figure 2.
Characterization of a SARS-CoV-2 replicon. (A) Kinetics of luminescence signal. The CHO-K1 cells were electroporated with 5 μg of replicon RNA. Intracellular luminescence signals were measured at the indicated time points. The mean and standard error of two independent experiments are shown in this figure. (B) Kinetics of the RNA copy. The CHO-K1 cells were electroporated with 10 μg of either the replicon RNA or the non-replicative N gene mRNA. RNA copy numbers were subsequently measured using qRT-PCR. The results were expressed as relative RNA copy number compared to that at 2 hpt. Multiple t-tests were performed for determining the statistical significance. A p-value < 0.05 was considered to be statistically significant. NS not significant. (C) The detection of N protein by IFA. The CHO-K1 cell was electroporated with 5 μg of replicon RNA. The cells were fixed with 4% paraformaldehyde, followed by permeabilization with 0.5% Triton-X. The expression of N protein was detected using anti-N mAb and goat-anti-mouse IgG conjugated with Alexa Fluor 488. Nucleus was stained by DAPI. (D) The detection of NSP8 protein by IFA. The expression of NSP8 protein was detected using anti-NSP8 mAb and goat-anti-mouse IgG conjugated with Alexa Fluor 488.

