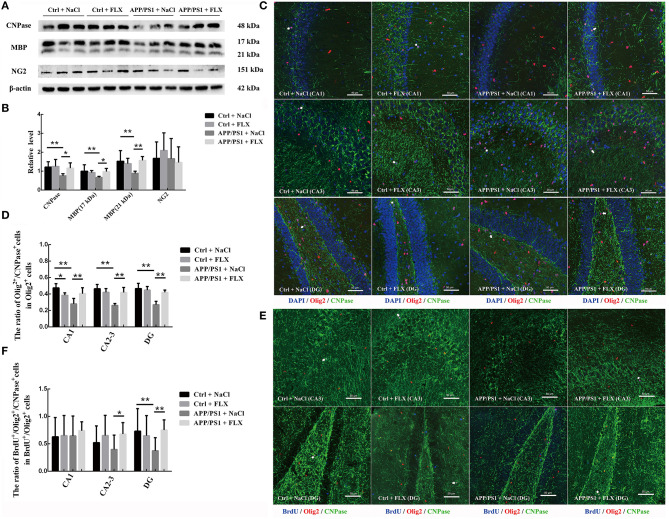
Figure 3.
The effects of FLX on the oligodendrocytes in the hippocampus of APP/PS1 mice. (A) Western blots showing the levels of CNPase, MBP and NG2 in the mouse hippocampus. (B) The relative levels of the CNPase, MBP and NG2 proteins in the hippocampus (x ± SD). (C) Immunofluorescence staining of mature oligodendrocytes (Olig2+/CNPase+ cells) in the hippocampus. Arrows (→) indicate Olig2+/CNPase+ cells. Bar = 50 μm. (D) The ratio of mature oligodendrocytes to oligodendrocyte lineage cells in the hippocampus (x ± SD). (E) Immunofluorescence staining of immature newborn mature oligodendrocytes (BrdU+/Olig2+/CNPase+ cells) in the hippocampus. Arrows (→) indicate BrdU+/Olig2+/CNPase+ cells. Bar = 50 μm. (F) The ratio of newborn mature oligodendrocytes to newborn oligodendrocyte lineage cells in the hippocampus (x ± SD). *p < 0.05. **p < 0.01.

