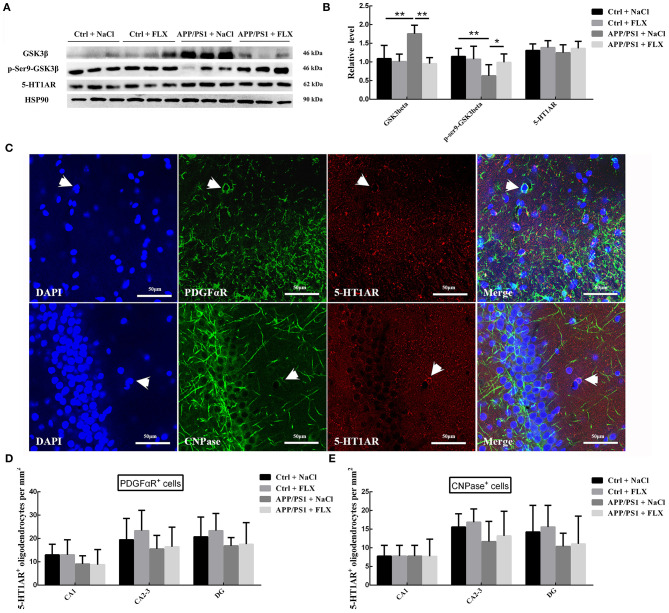
Figure 5.
The effects of FLX on GSK3β and 5-HT1AR levels in the hippocampus of APP/PS1 mice. (A) Western blots showing the levels of GSK3β, p-S9-GSK3β and 5-HT1AR in the hippocampus. (B) The relative levels of the GSK3β, p-S9-GSK3β and 5-HT1AR proteins in the hippocampus (x ± SD). *p < 0.05. **p < 0.01. (C) Immunofluorescence staining for 5-HT1AR in oligodendrocyte precursor cells (5-HT1AR+/PFDGαR+ cells, indicated with arrows) and mature oligodendrocytes (5-HT1AR+/CNPase+ cells, indicated with arrows) in the hippocampus. Bar = 50 μm. (D) The densities (x ± SD) of oligodendrocyte precursor cells expressing 5-HT1AR (5-HT1AR+/PFDGαR+ cells) in the hippocampus. (E) The densities (x ± SD) of mature oligodendrocytes expressing 5-HT1AR (5-HT1AR+/CNPase+ cells) in the hippocampus.

