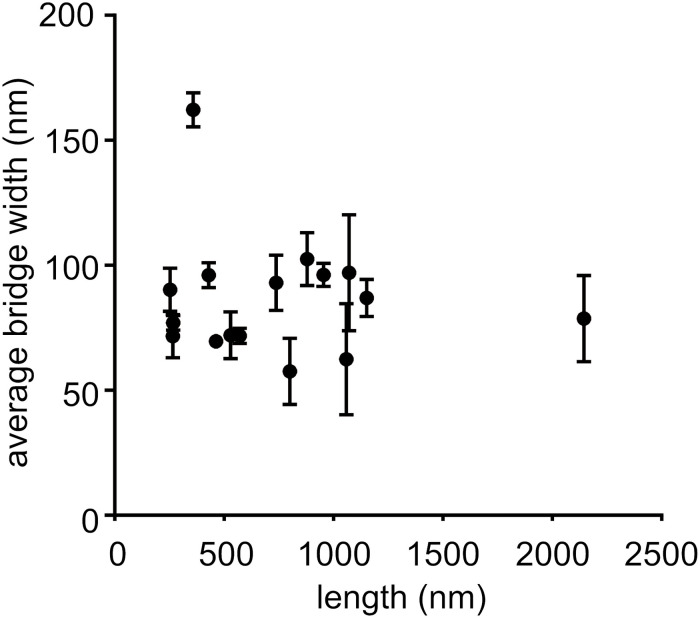
FIGURE 3.
Determination of length and width of cell–cell bridges. Scatter plot of length against the corresponding average width of cell–cell bridges. Six measurements of width per bridge were taken and average width with corresponding error were determined. Only cell–cell bridges were considered that connected two cells together (n = 16).

