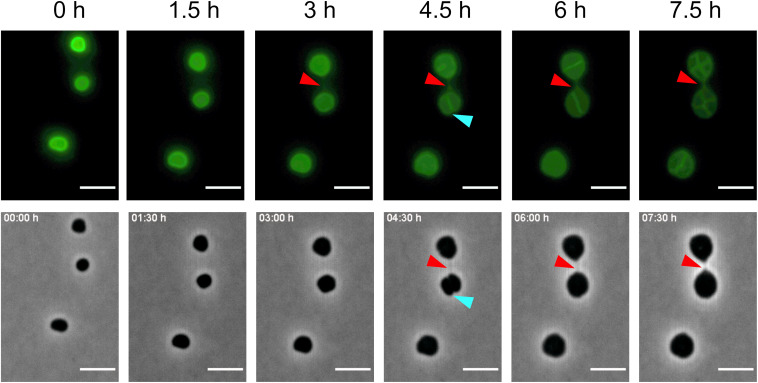
FIGURE 5.
Formation of a cell–cell bridge followed by fluorescence microscopy. Time-lapse fluorescence images of AlexaFluor488 labeled H. volcanii cells with the corresponding phase-contrast image. The fluorescence signal for the cell–cell bridge can be detected after 5 h and is indicated by a red arrow. In phase contrast, the cell–cell bridge can be detected after 7 h. Blue arrows indicate the septum formed between the cells due to a cell division defect. Scale bars are 4 μm.

