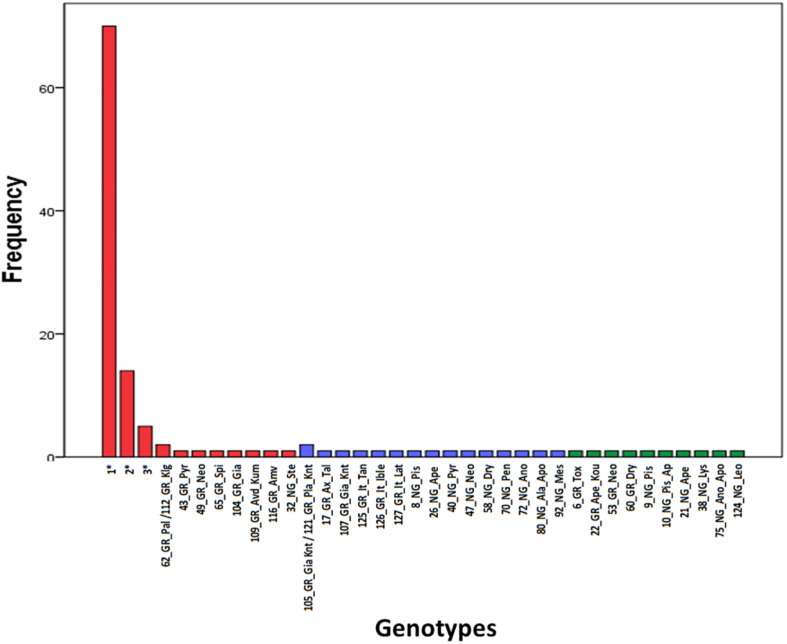
FIGURE 2.
Frequency of appearance of the 36 genotypes. Genotypes grouped into clusters (G) and (N) of the structure analysis are shown in red and blue color, respectively. Admixture (A) genotypes are shown in green color. The first component of the id code refers to tree number, the second to grafted (GR) or non-grafted trees (NG), the third to tree location and the fourth to the variety identification by farmers. Information concerning multiple tress assigned to genotypes 1, 2, and 3 can be found in Supplementary File 1.

