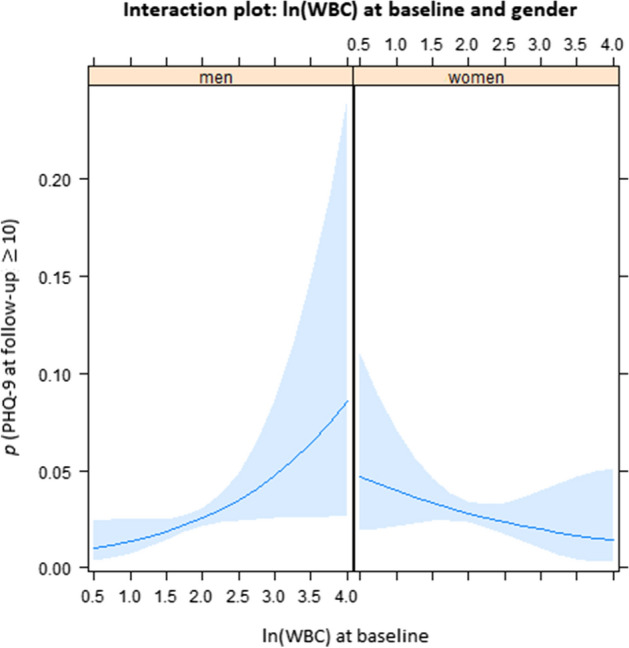
Figure 3.

Interaction plot between gender and natural log of white blood cell count as predictors of new onset of depression 5 years later. There were differences between men and women with respect to the association of elevated levels of WBC at baseline with new onset of depression at follow-up: in men, elevated WBC at baseline was more closely associated with higher PHQ-9 sum scores at follow-up. The plot results show the probability (p) and 95%-confidence intervals (shaded areas) of depression (PHQ-9), estimated based on the regression model of the total sample (reported in Table 4), depending on baseline natural log of WBC and other predictors held fixed. (Figures were created using R version 3.6.1 https://www.R-project.org/).
