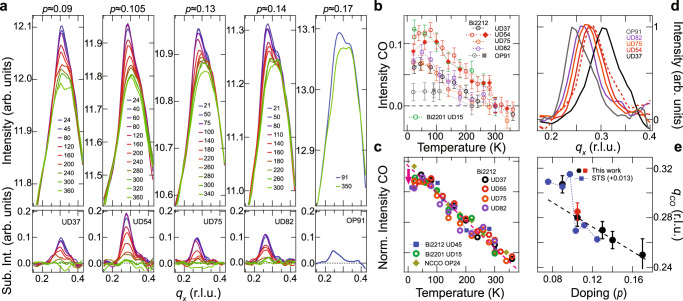
Fig. 3. Temperature and doping dependence of the directionally locked, short-range static charge order.
a EI-RXS scattering curves for different hole-concentrations and temperatures (top) and the respective charge order (CO) peaks obtained after subtracting the 300 K data (bottom). b Temperature dependence of the CO intensity for several dopings of Bi2212 and for underdoped Bi2201. The error bars in (b) represent the systematic errors associated with the experiment (see Supplementary Note 2). c Temperature dependence of the CO for Bi2212 and Bi2201 at multiple hole doping levels, as well as for the electron-doped cuprate NCCO, scaled to show that the curves collapse on a single line (red dashes) above ~75 K. All samples show a deviation from the linear behavior below 50 K signaling their competition with superconductivity, except for the electron-doped NCCO16. The Bi2212 UD45 and NCCO OP24 data are reproduced from refs. 14,59, respectively. d Low-temperature CO peaks normalized to their peak value showing the doping dependence of qCO. The red dashed and solid curves represent UD54 samples with and without Dy cation substitution, respectively. e CO peak location versus hole doping (holes/Cu) obtained from our bulk-sensitive experiments compared to the qCO values obtained from surface-sensitive STS experiments reported in ref. 14. The red and black points for p = 0.105 represent samples with and without Dy cation substitution, respectively. The dashed line in e is a guide to the eye. The labels indicate under (UD) and optimally doped (OP) followed by the value of their superconducting transition temperature. The error bars in (e) represent the 99% confidence interval of qCO values retrieved by fitting with a Gaussian function.

