FIGURE 9.
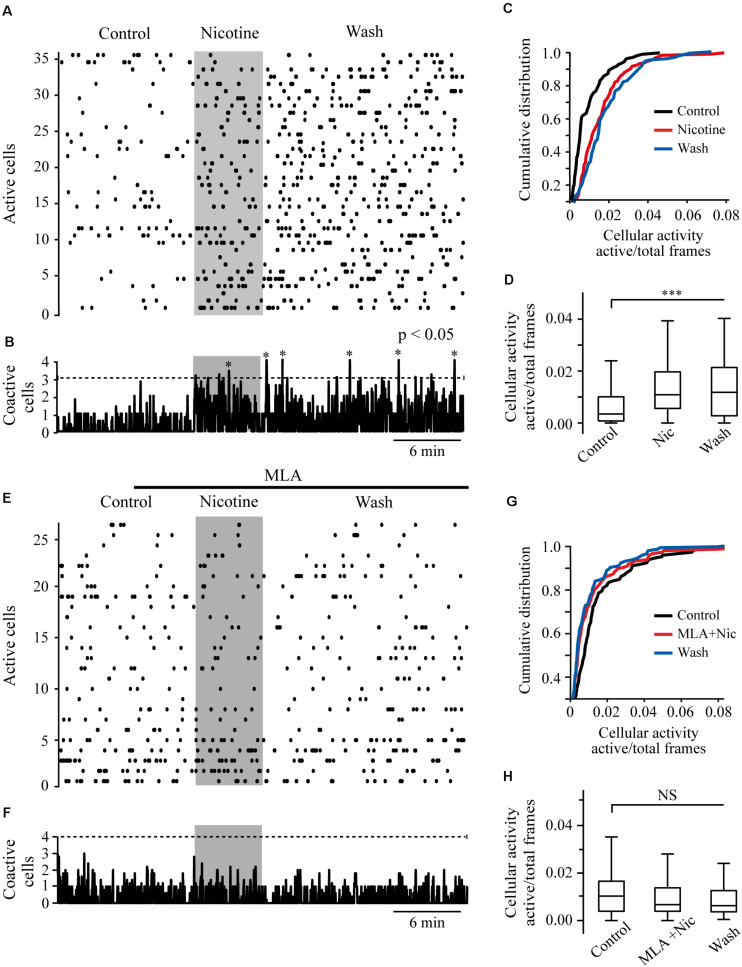
Nicotine increases RMTg neuronal activity. (A) Raster plot showing the spontaneous activity of 36 cells from a single experiment in RMTg nucleus. Rows represent the activity of individual neurons during the total time of the experiment. Columns are video frames converted to time in minutes. Note that cell activity is increased in nicotine (gray band) and wash conditions as compared with control. (B) Histogram showing coactive cell peaks, which represent the number of neurons that fired together in a given frame. Those peaks (asterisks) are statistically significant when they overpass the threshold (Monte Carlo test). Note that coactivity peaks occurrence started in nicotine but were more evident during the wash time. (C) Cumulative distribution of cellular activity of all cells in the three different conditions. Note that in nicotine (red line) and wash (blue line) conditions, the distributions were shifted to the right with respect to the control (black line), which indicates greater cellular activity. The distributions of nicotine and wash were statistically different as compared to control (p < 0.001). (D) Box plot of the cellular activity in the three different conditions, which shows the significant increase in activity in nicotine and wash conditions as compared to control (***p < 0.001, n = 146, six experiments). (E) Raster plot showing the spontaneous activity of 27 cells from a single experiment in RMTg nucleus. In the presence of MLA (100 nM, black bar), nicotine (gray band) did not increase cell activity. (F) The histogram shows that coactivity peaks did not change in the different conditions. (G) Cumulative distributions show no differences of cellular activity among the three conditions (p > 0.05). (H) Box plot of the cellular activity in the three different conditions did not show statistically significant changes of cell activity in nicotine in the presence of MLA (MLA+Nic) or wash conditions as compared to control (p > 0.05, n = 143, five experiments).

