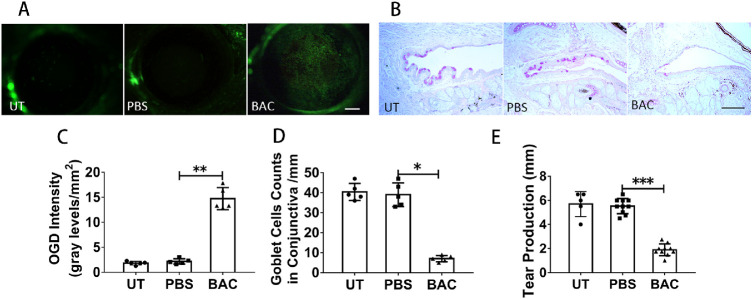
Figure 3.
Effects of topical application of BAC on the ocular surface. (A) Representative images of OGD staining in the conjunctiva. Scale bars: 500 µm. (B) Representative images of PAS staining in the conjunctiva. Scale bars: 100 µm. (C) Statistical analysis of the OGD intensity data. (D) Statistical analysis of the mean number of goblet cells. (E) Statistical analysis of tear production. The data are shown as the mean ± SD. *P <0.05, **P <0.01, ***P < 0.001 (n = 5 or 10).

