FIGURE 1.
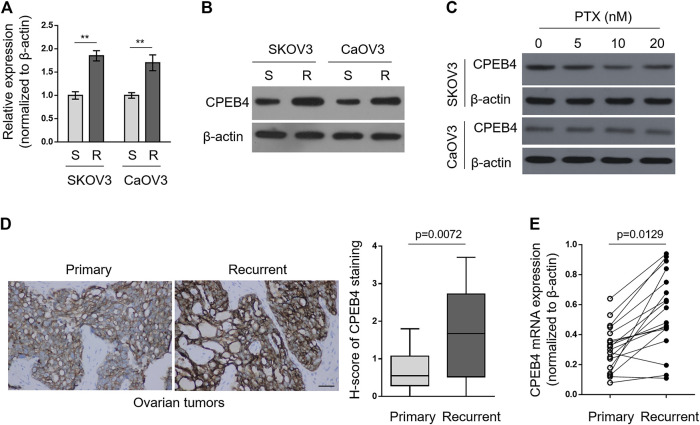
CPEB4 is upregulated in paclitaxel-resistant ovarian cancer cells and recurrent ovarian tumors. (A,B) The paclitaxel-resistant ovarian cancer cell lines SKOV3 (R) and CaOV3 (R) were established with treatment of increasing concentrations of paclitaxel (PTX) for over 7 months. The mRNA (A) and protein (B) levels of CPEB4 in these cells were analyzed by qRT-PCR and Western blotting analysis, and compared with those of naive sensitive cells, SKOV3 (S) and CaOV3 (S). β-Actin was used as a loading and reference control. The representative images are shown. Data represent mean ± SEM. n = 3. **p < 0.01. (C) SKOV3 (upper) and CaOV3 (lower) naive cells were treated with indicated concentrations of PTX for 72 h. The protein level of CPEB4 was analyzed by Western blotting. β-Actin was used as a loading control. The representative images are shown. (D) Representative images (left) of immunohistochemical staining of CPEB4 from matched primary and recurrent ovarian tumors treated with paclitaxel-based chemotherapy. Scale bar, 50 µm. H-score (right) is used to semi-quantify CPEB4 expression levels. The black line inside the box is the median, and the lines above and below the box indicate the maximum and minimum of the H-scores. Each group contained 18 paired samples. (E) The mRNA levels of CPEB4 in matched primary and recurrent ovarian tumors (D) were analyzed by qRT-PCR. β-Actin was used as a reference control. Each symbol represents the mean value of three replicates.

