Figure 4.
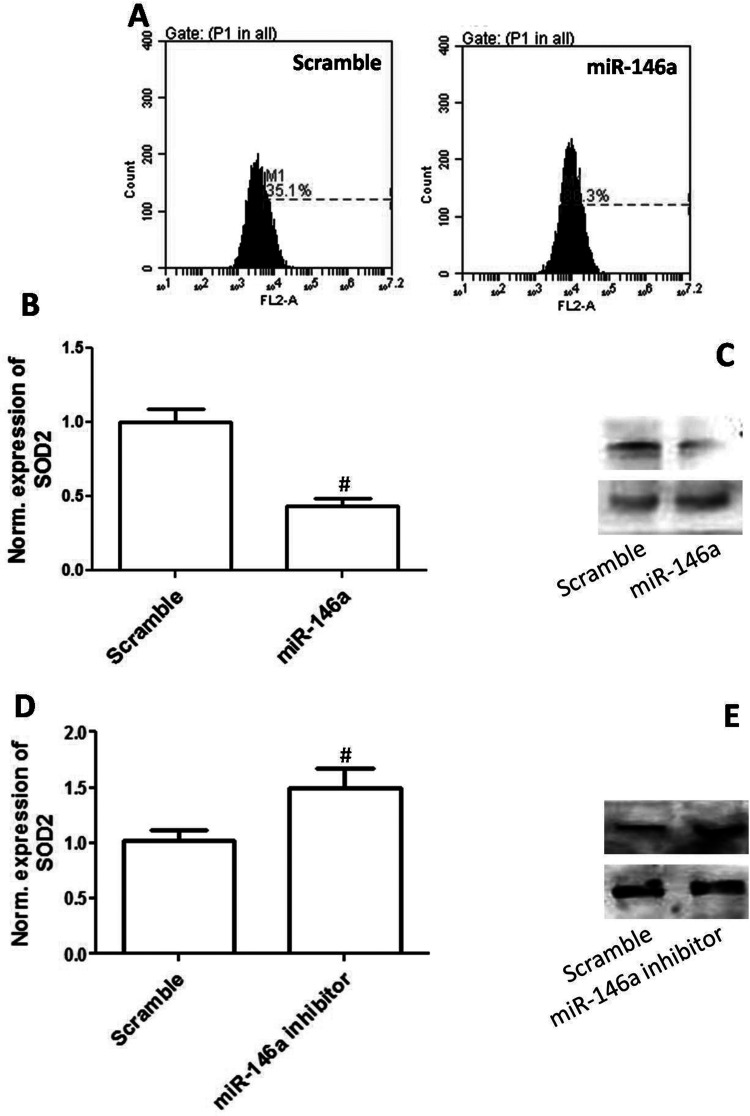
Overexpression of miR-146a increased ROS generation and inhibited SOD2 expression. CAOV3 cells were transfected with miR-146a mimics. (A) ROS level was detected by DHE (a superoxide probe, 10 µM) and analyzed by flow cytometry. (B) Relative mRNA expression of miR-146a is shown. (C) Protein expression of miR-146a is shown. CAOV3 cells were transfected with miR-146a inhibitors. (D) Relative mRNA expression of miR-146a is shown. (E) Protein expression of miR-146a is shown. #p < 0.05 indicates statistical significance, compared with scramble.

