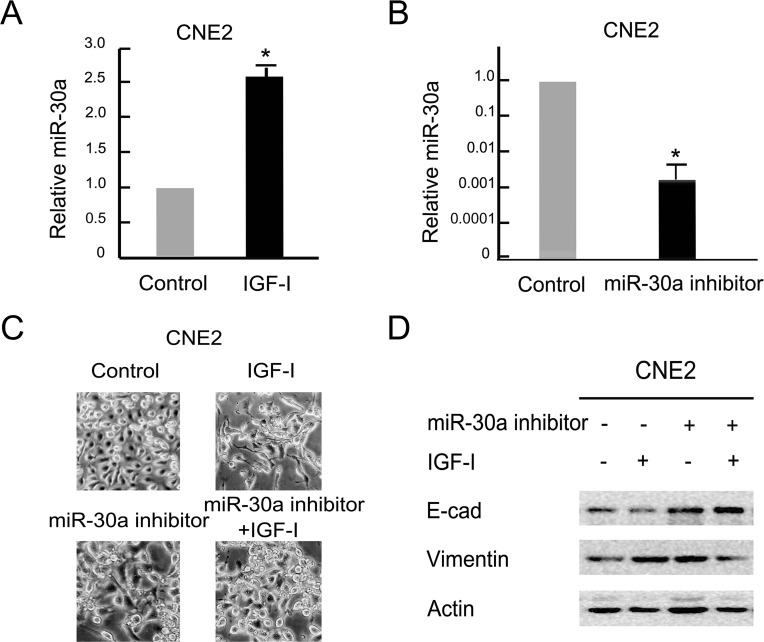
Figure 3.
Inhibition of miR-30a repressed IGF-I-induced EMT in NPC cells. (A) The serum-starved CNE2 cells were treated with IGF-I (100 ng/ml) for 48 h. The expression of miR-30a was analyzed by real-time polymerase chain reaction (PCR). Data are mean ± SD from three independent experiments. Control group as reference. *IGF-I untreated versus IGF-I treated, p < 0.05. (B) miR-30a inhibitor was transfected into CNE2 cells for 48 h. The expression of miR-30a was analyzed by real-time PCR. Data are mean ± SD from three independent experiments. Control group as reference. *Control transfected versus miR-30a inhibitor transfected, p < 0.05. (C, D) The serum-starved cells were transfected with or without the miR-30a inhibitor for 48 h followed by IGF-I (100 ng/ml) stimulation for 48 h. Cell lysates were collected for Western blot analysis. Photos were taken at 20× magnification. E-cad, E-cadherin.

