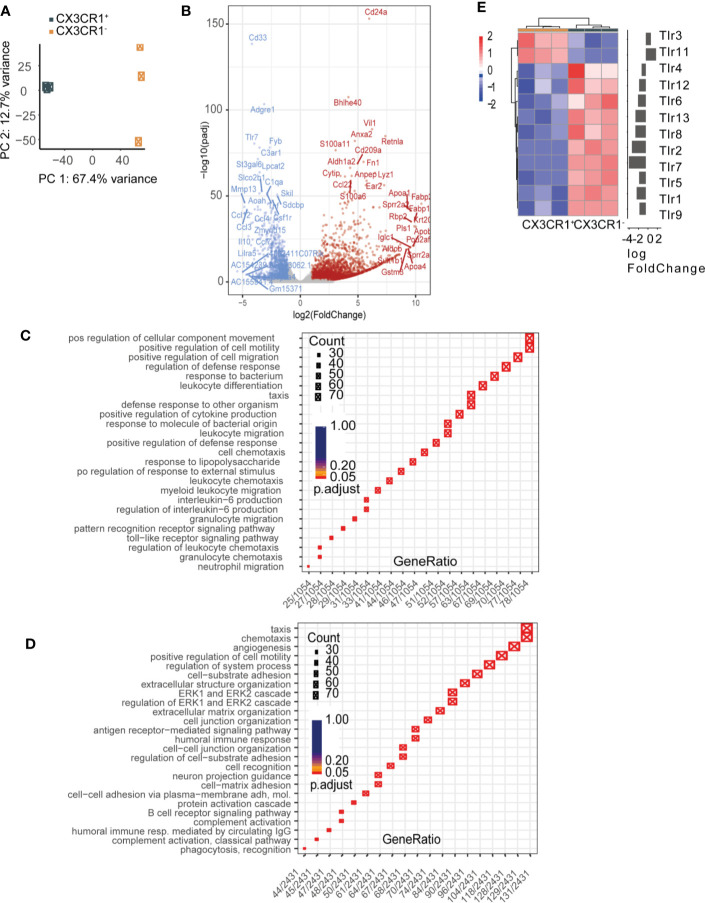
Figure 6.
Radio-resistant MHCIIhiCX3CR1- cells express toll-like receptor 3 (TLR3). MHCIIhiCX3CR1+ and MHCIIhiCX3CR1- cell populations were flow cytometry sorted from the muscularis externa (ME) of naive CX3CR1GFP/+ mice and underwent bulk RNA-seq. (A) Principal component analysis (PCA) and hierarchical clustering of samples confirming a segregation of CX3CR1+ and CX3CR1- populations according to their gene expression profiles. (B) Volcano plot showing significantly (adj. p-value < 0.05) differentially expressed genes as upregulated (FoldChange> 1, red) or downregulated (FoldChange < 1, blue) genes. Gray genes do not pass differentially expressed thresholds. Top 15 most highly significant genes are labeled for up and downregulated genes. (C, D) Visual representation of GO terms associated with enriched genes versus gene ratio showing genes downregulated (C) and upregulated D in CX3CR1- cells compared to CX3CR1+ cells. (E) Heatmap of TLR genes showing a unique expression pattern of TLR, with TLR3 and TLR11 being predominantly expressed on CX3CR1- cells. n = 3 (ME of six mice per group was pooled).

