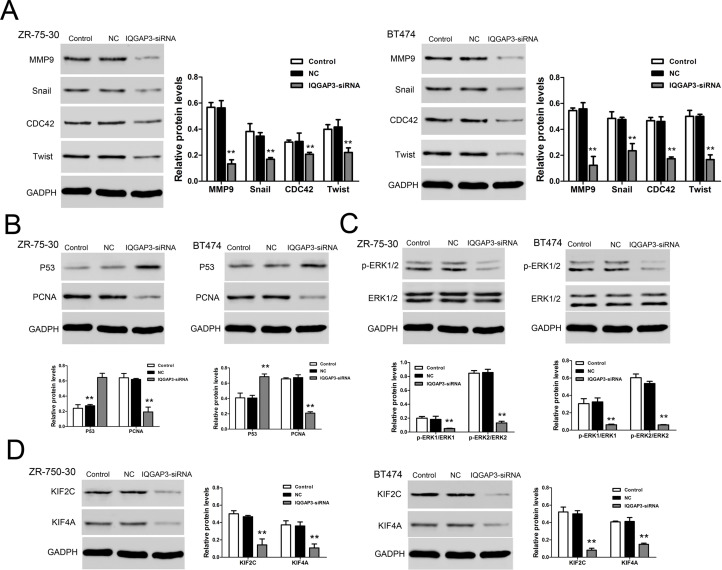
Figure 4.
Relative protein levels in ZR-75-30 and BT474 were analyzed by Western blot. (A) A representative data showed the related protein expression levels of MMP9, Snail, CDC42, and Twist in ZR-75-30 and BT474 cell lines. (B) Protein expression levels of p53 and PCNA in ZR-75-30 and BT474 cell lines. (C) Protein expression levels of p-ERK1/2 and ERK1/2 in ZR-75-30 and BT474 cell lines. (D) Protein expression levels of KIF2C and KIF4A in ZR-75-30 and BT474 cell lines. **p < 0.01 compared to the Control group.

