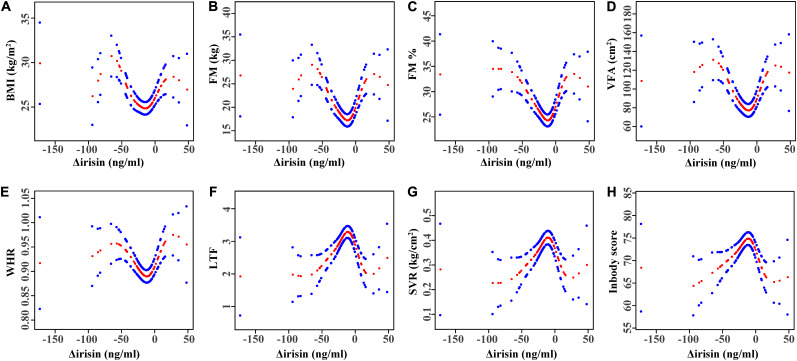
FIGURE 2.
Multivariate adjusted smoothing spline plots of anthropometric characteristics by Δirisin level. (A) Relationship between Δirisin levels and body mass index (BMI); (B) Δirisin levels with fat mass (FM); (C) Δirisin levels with percent body fat (FM%); (D) Δirisin levels with visceral fat area (VFA); (E) Δirisin levels with the waist-to-hip ratio (WHR); (F) Δirisin levels with the lean-to-fat ratio (LTF); (G) Δirisin levels with the skeletal muscle mass to visceral fat area ratio (SVR); and (H) Δirisin levels with the InBody score; The adjusted factors were age, gender, smoking, alcohol drinking, diabetes, distance swum per session, frequency of IS per week, and total years participating in IS. Red dotted lines represent the spline plots of Δirisin levels and blue dotted lines represent the 95% confidence intervals of the spline plots.

