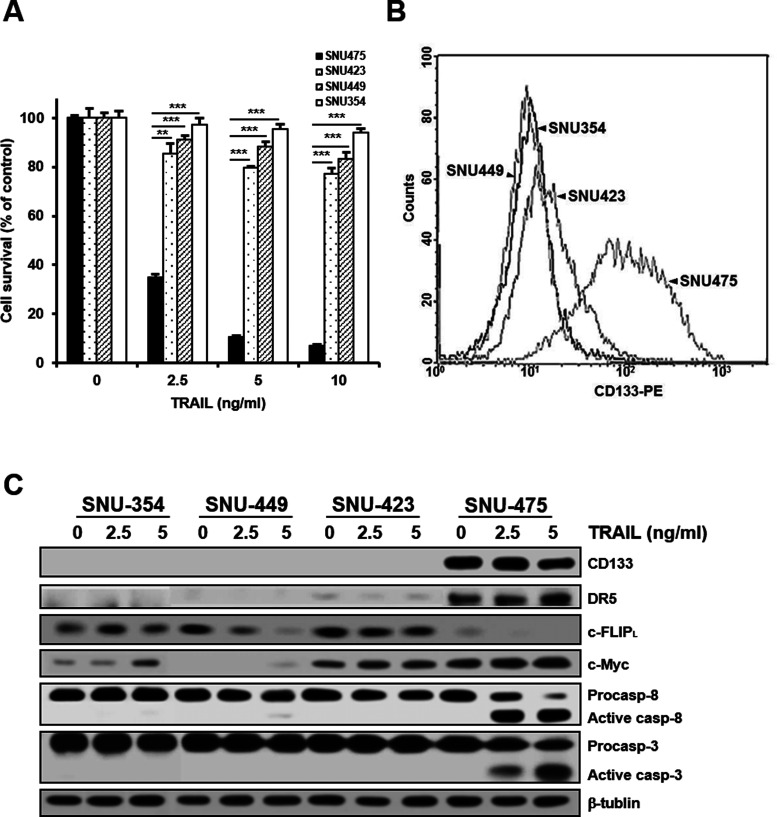
Figure 1.
Differential TRAIL sensitivity and expression pattern of CD133 and TRAIL-induced caspase activation among four HCC cell lines of primary HCC tumors. (A) The indicated cell lines were treated with various concentrations of TRAIL for 96 h. Percentage of cell survival was determined after 96 h of incubation using MTT assay. Each bar represents the mean ± SD of triplicate experiments. **p < 0.01 and ***p < 0.001. (B) The cell surface expression of CD133 after labeling each cell line with anti-CD133 antibody (1:10) was quantified by flow cytometry. (C) For the indicated cell lines treated with TRAIL (2.5 or 5 ng/ml for 6 h), the levels of CD133, DR5, c-FLIPL, and c-Myc and activation of caspase (casp) were determined by Western blot analysis. β-Tubulin (tubulin) was used as a loading control.

