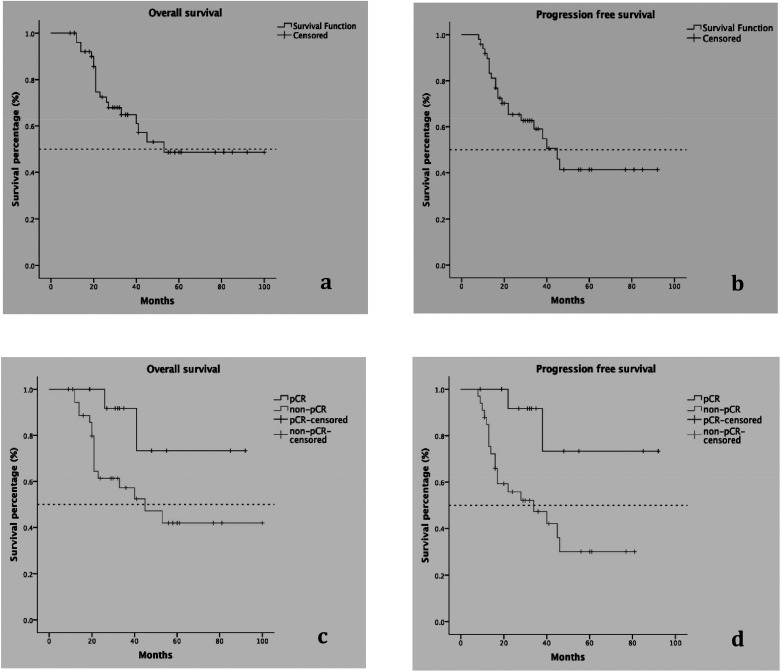
Figure 3.
Long-term survival in all TNBC patients and the comparison between patients with pCR and those with no pCR. (a) OS in all TNBC patients, (b) PFS in all TNBC patients, (c) comparison of OS in patients with pCR (upper line) and those without pCR (lower line), (d) comparison of PFS in patients with pCR (upper line) and those without pCR (lower line). Dashed line refers to the level of median survival rates. Patients with pCR had improved OS and PFS compared with their non-pCR counterparts.

